Candidatus Phytoplasma pruni
Taxonomy: cellular organisms; Bacteria; Terrabacteria group; Tenericutes; Mollicutes; Acholeplasmatales; Acholeplasmataceae; Candidatus Phytoplasma; 16SrIII (X-disease group)
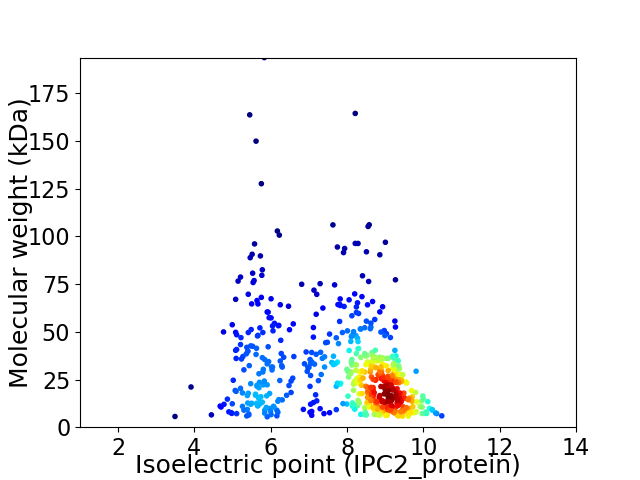
Average proteome isoelectric point is 7.74
Get precalculated fractions of proteins

Virtual 2D-PAGE plot for 549 proteins (isoelectric point calculated using IPC2_protein)
Get csv file with sequences according to given criteria:
* You can choose from 21 different methods for calculating isoelectric point
Summary statistics related to proteome-wise predictions


Protein with the lowest isoelectric point:
>tr|A0A0M1N007|A0A0M1N007_9MOLU Endo-1 4-beta-glucanase-like protein OS=Candidatus Phytoplasma pruni OX=479893 GN=frvX PE=3 SV=1
MM1 pKa = 7.4NEE3 pKa = 4.33KK4 pKa = 10.64KK5 pKa = 10.69NLIDD9 pKa = 4.74PNNSMIDD16 pKa = 3.01ISYY19 pKa = 10.85QILKK23 pKa = 9.58QNKK26 pKa = 7.68TSIPIYY32 pKa = 10.5QLMEE36 pKa = 3.67QVFQIRR42 pKa = 11.84QLDD45 pKa = 3.73FTDD48 pKa = 3.67VEE50 pKa = 4.81KK51 pKa = 11.21VSQLYY56 pKa = 10.75LDD58 pKa = 3.96IVLSGLFVFNGQDD71 pKa = 3.37LWCVKK76 pKa = 10.47AGNLHH81 pKa = 6.49LWDD84 pKa = 3.63KK85 pKa = 10.79EE86 pKa = 4.23YY87 pKa = 11.23YY88 pKa = 10.18AEE90 pKa = 6.08KK91 pKa = 10.21DD92 pKa = 3.69DD93 pKa = 6.34KK94 pKa = 11.47DD95 pKa = 5.1DD96 pKa = 4.94EE97 pKa = 4.37EE98 pKa = 4.52QTDD101 pKa = 3.72IDD103 pKa = 4.35HH104 pKa = 7.36KK105 pKa = 11.18ILDD108 pKa = 4.28FEE110 pKa = 5.68DD111 pKa = 4.04FTLKK115 pKa = 10.55PKK117 pKa = 10.74NDD119 pKa = 3.94DD120 pKa = 3.58SHH122 pKa = 9.05DD123 pKa = 3.87EE124 pKa = 4.5DD125 pKa = 4.41SDD127 pKa = 3.58EE128 pKa = 4.32HH129 pKa = 8.19KK130 pKa = 11.24EE131 pKa = 4.13EE132 pKa = 4.27IEE134 pKa = 3.97EE135 pKa = 4.18ALDD138 pKa = 3.44IDD140 pKa = 5.65SEE142 pKa = 4.67HH143 pKa = 7.31LDD145 pKa = 3.57NDD147 pKa = 3.41IKK149 pKa = 11.04KK150 pKa = 9.29PQVDD154 pKa = 4.49LNSVSDD160 pKa = 4.46DD161 pKa = 3.85DD162 pKa = 5.42VKK164 pKa = 11.32EE165 pKa = 4.31DD166 pKa = 5.58DD167 pKa = 5.04INDD170 pKa = 3.82EE171 pKa = 3.85YY172 pKa = 11.59DD173 pKa = 3.37YY174 pKa = 11.38LYY176 pKa = 11.09DD177 pKa = 3.47QQ178 pKa = 4.9
MM1 pKa = 7.4NEE3 pKa = 4.33KK4 pKa = 10.64KK5 pKa = 10.69NLIDD9 pKa = 4.74PNNSMIDD16 pKa = 3.01ISYY19 pKa = 10.85QILKK23 pKa = 9.58QNKK26 pKa = 7.68TSIPIYY32 pKa = 10.5QLMEE36 pKa = 3.67QVFQIRR42 pKa = 11.84QLDD45 pKa = 3.73FTDD48 pKa = 3.67VEE50 pKa = 4.81KK51 pKa = 11.21VSQLYY56 pKa = 10.75LDD58 pKa = 3.96IVLSGLFVFNGQDD71 pKa = 3.37LWCVKK76 pKa = 10.47AGNLHH81 pKa = 6.49LWDD84 pKa = 3.63KK85 pKa = 10.79EE86 pKa = 4.23YY87 pKa = 11.23YY88 pKa = 10.18AEE90 pKa = 6.08KK91 pKa = 10.21DD92 pKa = 3.69DD93 pKa = 6.34KK94 pKa = 11.47DD95 pKa = 5.1DD96 pKa = 4.94EE97 pKa = 4.37EE98 pKa = 4.52QTDD101 pKa = 3.72IDD103 pKa = 4.35HH104 pKa = 7.36KK105 pKa = 11.18ILDD108 pKa = 4.28FEE110 pKa = 5.68DD111 pKa = 4.04FTLKK115 pKa = 10.55PKK117 pKa = 10.74NDD119 pKa = 3.94DD120 pKa = 3.58SHH122 pKa = 9.05DD123 pKa = 3.87EE124 pKa = 4.5DD125 pKa = 4.41SDD127 pKa = 3.58EE128 pKa = 4.32HH129 pKa = 8.19KK130 pKa = 11.24EE131 pKa = 4.13EE132 pKa = 4.27IEE134 pKa = 3.97EE135 pKa = 4.18ALDD138 pKa = 3.44IDD140 pKa = 5.65SEE142 pKa = 4.67HH143 pKa = 7.31LDD145 pKa = 3.57NDD147 pKa = 3.41IKK149 pKa = 11.04KK150 pKa = 9.29PQVDD154 pKa = 4.49LNSVSDD160 pKa = 4.46DD161 pKa = 3.85DD162 pKa = 5.42VKK164 pKa = 11.32EE165 pKa = 4.31DD166 pKa = 5.58DD167 pKa = 5.04INDD170 pKa = 3.82EE171 pKa = 3.85YY172 pKa = 11.59DD173 pKa = 3.37YY174 pKa = 11.38LYY176 pKa = 11.09DD177 pKa = 3.47QQ178 pKa = 4.9
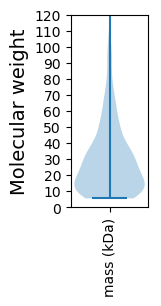
Molecular weight: 21.07 kDa
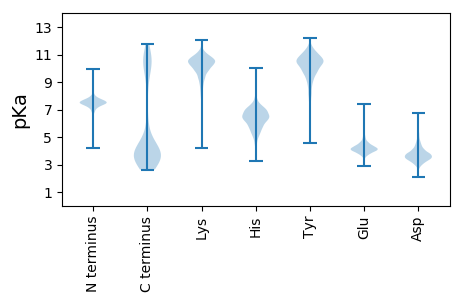
Isoelectric point according different methods:
Protein with the highest isoelectric point:
>tr|A0A0M1MZB5|A0A0M1MZB5_9MOLU Protein RecA OS=Candidatus Phytoplasma pruni OX=479893 GN=recA PE=3 SV=1
MM1 pKa = 7.33FRR3 pKa = 11.84LKK5 pKa = 10.7NQFKK9 pKa = 10.41IIYY12 pKa = 8.77LCLISFILLLFIFNNPLMAMHH33 pKa = 7.05NGNATPNNGHH43 pKa = 6.8HH44 pKa = 5.68NTNFEE49 pKa = 4.25TKK51 pKa = 10.26AHH53 pKa = 6.91ILQEE57 pKa = 4.21MNRR60 pKa = 11.84EE61 pKa = 3.57QAAIVQQIFNARR73 pKa = 11.84NNNDD77 pKa = 3.13SEE79 pKa = 4.65EE80 pKa = 4.36IINNLVRR87 pKa = 11.84QNIQLSQRR95 pKa = 11.84ISTQQINLHH104 pKa = 5.59NAMPHH109 pKa = 5.34EE110 pKa = 4.45NNRR113 pKa = 11.84NQLNNSNNRR122 pKa = 11.84RR123 pKa = 11.84RR124 pKa = 3.57
MM1 pKa = 7.33FRR3 pKa = 11.84LKK5 pKa = 10.7NQFKK9 pKa = 10.41IIYY12 pKa = 8.77LCLISFILLLFIFNNPLMAMHH33 pKa = 7.05NGNATPNNGHH43 pKa = 6.8HH44 pKa = 5.68NTNFEE49 pKa = 4.25TKK51 pKa = 10.26AHH53 pKa = 6.91ILQEE57 pKa = 4.21MNRR60 pKa = 11.84EE61 pKa = 3.57QAAIVQQIFNARR73 pKa = 11.84NNNDD77 pKa = 3.13SEE79 pKa = 4.65EE80 pKa = 4.36IINNLVRR87 pKa = 11.84QNIQLSQRR95 pKa = 11.84ISTQQINLHH104 pKa = 5.59NAMPHH109 pKa = 5.34EE110 pKa = 4.45NNRR113 pKa = 11.84NQLNNSNNRR122 pKa = 11.84RR123 pKa = 11.84RR124 pKa = 3.57
Molecular weight: 14.62 kDa
Isoelectric point according different methods:
Peptides (in silico digests for buttom-up proteomics)
Below you can find in silico digests of the whole proteome with Trypsin, Chymotrypsin, Trypsin+LysC, LysN, ArgC proteases suitable for different mass spec machines.| Try ESI |
 |
|---|
| ChTry ESI |
 |
|---|
| ArgC ESI |
 |
|---|
| LysN ESI |
 |
|---|
| TryLysC ESI |
 |
|---|
| Try MALDI |
 |
|---|
| ChTry MALDI |
 |
|---|
| ArgC MALDI |
 |
|---|
| LysN MALDI |
 |
|---|
| TryLysC MALDI |
 |
|---|
| Try LTQ |
 |
|---|
| ChTry LTQ |
 |
|---|
| ArgC LTQ |
 |
|---|
| LysN LTQ |
 |
|---|
| TryLysC LTQ |
 |
|---|
| Try MSlow |
 |
|---|
| ChTry MSlow |
 |
|---|
| ArgC MSlow |
 |
|---|
| LysN MSlow |
 |
|---|
| TryLysC MSlow |
 |
|---|
| Try MShigh |
 |
|---|
| ChTry MShigh |
 |
|---|
| ArgC MShigh |
 |
|---|
| LysN MShigh |
 |
|---|
| TryLysC MShigh |
 |
|---|
General Statistics
Number of major isoforms |
Number of additional isoforms |
Number of all proteins |
Number of amino acids |
Min. Seq. Length |
Max. Seq. Length |
Avg. Seq. Length |
Avg. Mol. Weight |
|---|---|---|---|---|---|---|---|
0 |
146841 |
50 |
1638 |
267.5 |
30.87 |
Amino acid frequency
Ala |
Cys |
Asp |
Glu |
Phe |
Gly |
His |
Ile |
Lys |
Leu |
|---|---|---|---|---|---|---|---|---|---|
4.405 ± 0.09 | 0.615 ± 0.027 |
4.964 ± 0.066 | 6.879 ± 0.12 |
5.684 ± 0.117 | 4.47 ± 0.105 |
1.946 ± 0.04 | 9.172 ± 0.112 |
10.894 ± 0.124 | 10.639 ± 0.104 |
Met |
Asn |
Gln |
Pro |
Arg |
Ser |
Thr |
Val |
Trp |
Tyr |
|---|---|---|---|---|---|---|---|---|---|
2.117 ± 0.045 | 6.936 ± 0.1 |
2.943 ± 0.067 | 4.702 ± 0.093 |
2.89 ± 0.068 | 5.783 ± 0.07 |
4.997 ± 0.07 | 5.541 ± 0.113 |
0.604 ± 0.037 | 3.818 ± 0.061 |
Most of the basic statistics you can see at this page can be downloaded from this CSV file
Proteome-pI is available under Creative Commons Attribution-NoDerivs license, for more details see here
| Reference: Kozlowski LP. Proteome-pI 2.0: Proteome Isoelectric Point Database Update. Nucleic Acids Res. 2021, doi: 10.1093/nar/gkab944 | Contact: Lukasz P. Kozlowski |
