Cassava virus X
Taxonomy: Viruses; Riboviria; Orthornavirae; Kitrinoviricota; Alsuviricetes; Tymovirales; Alphaflexiviridae; Potexvirus
Average proteome isoelectric point is 6.97
Get precalculated fractions of proteins

Virtual 2D-PAGE plot for 4 proteins (isoelectric point calculated using IPC2_protein)
Get csv file with sequences according to given criteria:
* You can choose from 21 different methods for calculating isoelectric point
Summary statistics related to proteome-wise predictions


Protein with the lowest isoelectric point:
>tr|A0A1W5VPI1|A0A1W5VPI1_9VIRU ORF1 protein OS=Cassava virus X OX=1977392 GN=RdRp PE=4 SV=1
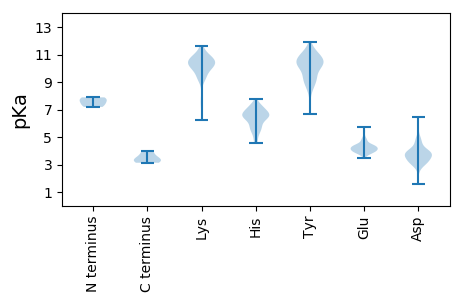
MM1 pKa = 7.73CSHH4 pKa = 6.65GLMDD8 pKa = 6.46AILRR12 pKa = 11.84EE13 pKa = 4.38LKK15 pKa = 10.51QSGFVQIRR23 pKa = 11.84NHH25 pKa = 5.62LQNPLVVHH33 pKa = 6.44AVAGAGKK40 pKa = 6.88TTLLNKK46 pKa = 10.06LAACSDD52 pKa = 4.77LIIHH56 pKa = 6.24SAAYY60 pKa = 9.39PSGNSLSGNSVQIHH74 pKa = 5.91NPSVTPDD81 pKa = 3.13ILDD84 pKa = 3.87EE85 pKa = 4.18YY86 pKa = 11.3LLVPDD91 pKa = 4.46YY92 pKa = 10.66KK93 pKa = 10.93ASKK96 pKa = 10.47LLIADD101 pKa = 4.51PLQYY105 pKa = 10.21SAKK108 pKa = 9.8PPLAHH113 pKa = 7.14FIKK116 pKa = 10.19ATTHH120 pKa = 6.69RR121 pKa = 11.84FGQSTCALLRR131 pKa = 11.84SLLKK135 pKa = 10.43IEE137 pKa = 4.37VDD139 pKa = 3.12SDD141 pKa = 3.72RR142 pKa = 11.84PDD144 pKa = 3.17TVVISRR150 pKa = 11.84FFEE153 pKa = 4.44GEE155 pKa = 3.84PEE157 pKa = 3.94GAIIAFGEE165 pKa = 4.15EE166 pKa = 4.38AYY168 pKa = 10.66HH169 pKa = 7.14LISAHH174 pKa = 4.59QLKK177 pKa = 10.03PFRR180 pKa = 11.84PCEE183 pKa = 4.01VYY185 pKa = 10.54GLSFPVVTVAFEE197 pKa = 4.19QEE199 pKa = 3.58VDD201 pKa = 3.31KK202 pKa = 11.44YY203 pKa = 10.34PPHH206 pKa = 6.66LVYY209 pKa = 10.71LALSRR214 pKa = 11.84HH215 pKa = 4.63TEE217 pKa = 3.76KK218 pKa = 11.18LIILSDD224 pKa = 3.77ALASSSS230 pKa = 3.33
MM1 pKa = 7.73CSHH4 pKa = 6.65GLMDD8 pKa = 6.46AILRR12 pKa = 11.84EE13 pKa = 4.38LKK15 pKa = 10.51QSGFVQIRR23 pKa = 11.84NHH25 pKa = 5.62LQNPLVVHH33 pKa = 6.44AVAGAGKK40 pKa = 6.88TTLLNKK46 pKa = 10.06LAACSDD52 pKa = 4.77LIIHH56 pKa = 6.24SAAYY60 pKa = 9.39PSGNSLSGNSVQIHH74 pKa = 5.91NPSVTPDD81 pKa = 3.13ILDD84 pKa = 3.87EE85 pKa = 4.18YY86 pKa = 11.3LLVPDD91 pKa = 4.46YY92 pKa = 10.66KK93 pKa = 10.93ASKK96 pKa = 10.47LLIADD101 pKa = 4.51PLQYY105 pKa = 10.21SAKK108 pKa = 9.8PPLAHH113 pKa = 7.14FIKK116 pKa = 10.19ATTHH120 pKa = 6.69RR121 pKa = 11.84FGQSTCALLRR131 pKa = 11.84SLLKK135 pKa = 10.43IEE137 pKa = 4.37VDD139 pKa = 3.12SDD141 pKa = 3.72RR142 pKa = 11.84PDD144 pKa = 3.17TVVISRR150 pKa = 11.84FFEE153 pKa = 4.44GEE155 pKa = 3.84PEE157 pKa = 3.94GAIIAFGEE165 pKa = 4.15EE166 pKa = 4.38AYY168 pKa = 10.66HH169 pKa = 7.14LISAHH174 pKa = 4.59QLKK177 pKa = 10.03PFRR180 pKa = 11.84PCEE183 pKa = 4.01VYY185 pKa = 10.54GLSFPVVTVAFEE197 pKa = 4.19QEE199 pKa = 3.58VDD201 pKa = 3.31KK202 pKa = 11.44YY203 pKa = 10.34PPHH206 pKa = 6.66LVYY209 pKa = 10.71LALSRR214 pKa = 11.84HH215 pKa = 4.63TEE217 pKa = 3.76KK218 pKa = 11.18LIILSDD224 pKa = 3.77ALASSSS230 pKa = 3.33
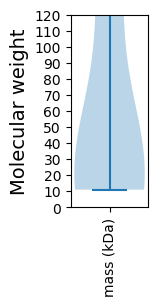
Molecular weight: 25.17 kDa
Isoelectric point according different methods:
Protein with the highest isoelectric point:
>tr|A0A1W5VPI7|A0A1W5VPI7_9VIRU Coat protein OS=Cassava virus X OX=1977392 GN=CP PE=3 SV=1
MM1 pKa = 7.88PLQAPPDD8 pKa = 4.06PNRR11 pKa = 11.84TYY13 pKa = 11.13QLVGVCTAVICICYY27 pKa = 10.12FLTQDD32 pKa = 3.1NRR34 pKa = 11.84GFSGDD39 pKa = 3.88RR40 pKa = 11.84EE41 pKa = 3.95NSFPNGGKK49 pKa = 10.28LSYY52 pKa = 10.73CKK54 pKa = 9.34TAVFHH59 pKa = 6.63PPNHH63 pKa = 7.09RR64 pKa = 11.84DD65 pKa = 3.4SQAGAHH71 pKa = 6.41IFLLVIALTALIIFLSRR88 pKa = 11.84RR89 pKa = 11.84TPHH92 pKa = 6.49SCPQCRR98 pKa = 11.84GG99 pKa = 3.13
MM1 pKa = 7.88PLQAPPDD8 pKa = 4.06PNRR11 pKa = 11.84TYY13 pKa = 11.13QLVGVCTAVICICYY27 pKa = 10.12FLTQDD32 pKa = 3.1NRR34 pKa = 11.84GFSGDD39 pKa = 3.88RR40 pKa = 11.84EE41 pKa = 3.95NSFPNGGKK49 pKa = 10.28LSYY52 pKa = 10.73CKK54 pKa = 9.34TAVFHH59 pKa = 6.63PPNHH63 pKa = 7.09RR64 pKa = 11.84DD65 pKa = 3.4SQAGAHH71 pKa = 6.41IFLLVIALTALIIFLSRR88 pKa = 11.84RR89 pKa = 11.84TPHH92 pKa = 6.49SCPQCRR98 pKa = 11.84GG99 pKa = 3.13
Molecular weight: 10.93 kDa
Isoelectric point according different methods:
Peptides (in silico digests for buttom-up proteomics)
Below you can find in silico digests of the whole proteome with Trypsin, Chymotrypsin, Trypsin+LysC, LysN, ArgC proteases suitable for different mass spec machines.| Try ESI |
 |
|---|
| ChTry ESI |
 |
|---|
| ArgC ESI |
 |
|---|
| LysN ESI |
 |
|---|
| TryLysC ESI |
 |
|---|
| Try MALDI |
 |
|---|
| ChTry MALDI |
 |
|---|
| ArgC MALDI |
 |
|---|
| LysN MALDI |
 |
|---|
| TryLysC MALDI |
 |
|---|
| Try LTQ |
 |
|---|
| ChTry LTQ |
 |
|---|
| ArgC LTQ |
 |
|---|
| LysN LTQ |
 |
|---|
| TryLysC LTQ |
 |
|---|
| Try MSlow |
 |
|---|
| ChTry MSlow |
 |
|---|
| ArgC MSlow |
 |
|---|
| LysN MSlow |
 |
|---|
| TryLysC MSlow |
 |
|---|
| Try MShigh |
 |
|---|
| ChTry MShigh |
 |
|---|
| ArgC MShigh |
 |
|---|
| LysN MShigh |
 |
|---|
| TryLysC MShigh |
 |
|---|
General Statistics
Number of major isoforms |
Number of additional isoforms |
Number of all proteins |
Number of amino acids |
Min. Seq. Length |
Max. Seq. Length |
Avg. Seq. Length |
Avg. Mol. Weight |
|---|---|---|---|---|---|---|---|
0 |
1847 |
99 |
1304 |
461.8 |
51.63 |
Amino acid frequency
Ala |
Cys |
Asp |
Glu |
Phe |
Gly |
His |
Ile |
Lys |
Leu |
|---|---|---|---|---|---|---|---|---|---|
8.825 ± 1.751 | 1.516 ± 0.556 |
5.36 ± 0.676 | 5.522 ± 0.743 |
4.331 ± 0.176 | 4.656 ± 0.271 |
2.978 ± 0.412 | 5.901 ± 0.22 |
5.685 ± 0.72 | 10.07 ± 0.538 |
Met |
Asn |
Gln |
Pro |
Arg |
Ser |
Thr |
Val |
Trp |
Tyr |
|---|---|---|---|---|---|---|---|---|---|
2.057 ± 0.283 | 3.736 ± 0.208 |
6.605 ± 0.198 | 4.115 ± 0.11 |
5.035 ± 0.399 | 6.876 ± 0.553 |
6.876 ± 0.716 | 5.631 ± 0.28 |
1.029 ± 0.246 | 3.194 ± 0.492 |
Most of the basic statistics you can see at this page can be downloaded from this CSV file
Proteome-pI is available under Creative Commons Attribution-NoDerivs license, for more details see here
| Reference: Kozlowski LP. Proteome-pI 2.0: Proteome Isoelectric Point Database Update. Nucleic Acids Res. 2021, doi: 10.1093/nar/gkab944 | Contact: Lukasz P. Kozlowski |
