Thermosulfurimonas dismutans
Taxonomy: cellular organisms; Bacteria; Thermodesulfobacteria; Thermodesulfobacteria; Thermodesulfobacteriales; Thermodesulfobacteriaceae; Thermosulfurimonas
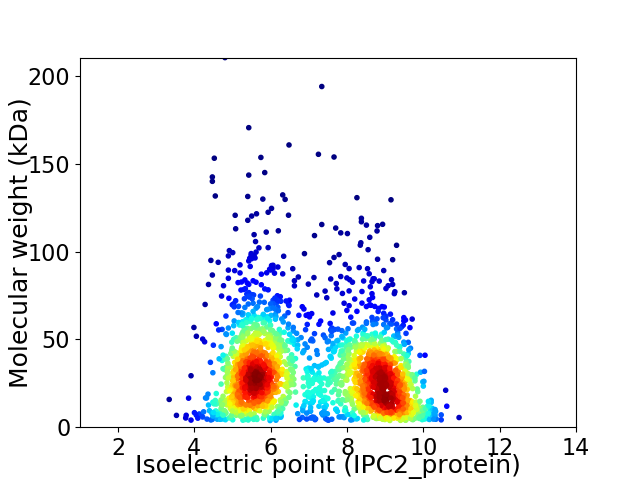
Average proteome isoelectric point is 7.11
Get precalculated fractions of proteins

Virtual 2D-PAGE plot for 2157 proteins (isoelectric point calculated using IPC2_protein)
Get csv file with sequences according to given criteria:
* You can choose from 21 different methods for calculating isoelectric point
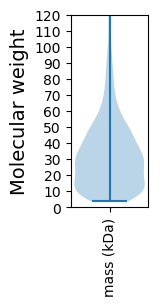
Summary statistics related to proteome-wise predictions


Protein with the lowest isoelectric point:
>tr|A0A179D583|A0A179D583_9BACT 5 10-methylenetetrahydrofolate reductase OS=Thermosulfurimonas dismutans OX=999894 GN=TDIS_1006 PE=4 SV=1
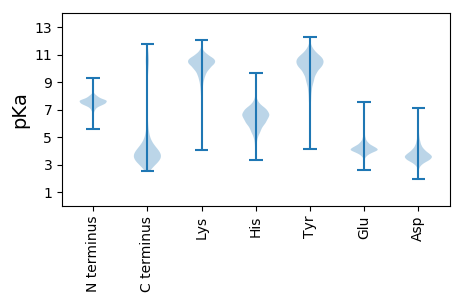
MM1 pKa = 7.36GGARR5 pKa = 11.84RR6 pKa = 11.84IWVVLGFVVFGLWLLAGGVRR26 pKa = 11.84AEE28 pKa = 4.13EE29 pKa = 4.48AKK31 pKa = 10.52PSADD35 pKa = 3.14FTVDD39 pKa = 3.23VLSQYY44 pKa = 7.35VWRR47 pKa = 11.84GFGLSDD53 pKa = 4.17DD54 pKa = 4.3SVVIQPSMTVSYY66 pKa = 10.76LGAYY70 pKa = 8.55VNLWGNYY77 pKa = 7.82DD78 pKa = 3.66TDD80 pKa = 3.84EE81 pKa = 5.25KK82 pKa = 11.38GSDD85 pKa = 3.23DD86 pKa = 4.63ANWNEE91 pKa = 3.76TDD93 pKa = 3.66FTFGYY98 pKa = 9.17TYY100 pKa = 11.29DD101 pKa = 3.63KK102 pKa = 10.96LPYY105 pKa = 10.54GMSLDD110 pKa = 3.59VGGIYY115 pKa = 10.26YY116 pKa = 10.78ALDD119 pKa = 4.8GIDD122 pKa = 5.12DD123 pKa = 4.08SFEE126 pKa = 4.22LFAGLSATCPKK137 pKa = 10.18TGINFGLTIYY147 pKa = 10.49RR148 pKa = 11.84EE149 pKa = 4.03LSHH152 pKa = 7.15YY153 pKa = 10.11PGTWYY158 pKa = 10.08EE159 pKa = 3.97LSAGRR164 pKa = 11.84DD165 pKa = 3.75FGLPWYY171 pKa = 10.01KK172 pKa = 10.19ATLSLSASAMYY183 pKa = 10.5LDD185 pKa = 4.99SDD187 pKa = 5.02DD188 pKa = 4.23KK189 pKa = 11.47GAYY192 pKa = 8.15PDD194 pKa = 4.7PDD196 pKa = 3.96DD197 pKa = 5.54PNDD200 pKa = 3.73EE201 pKa = 4.29FSGWLYY207 pKa = 10.66LQLGAEE213 pKa = 4.29VSVPVGRR220 pKa = 11.84YY221 pKa = 6.75FTVTPKK227 pKa = 10.51VYY229 pKa = 10.81YY230 pKa = 10.41SFSLSDD236 pKa = 4.13DD237 pKa = 3.85ADD239 pKa = 3.93DD240 pKa = 5.98LIEE243 pKa = 5.25DD244 pKa = 4.45GSWDD248 pKa = 3.38NHH250 pKa = 5.93HH251 pKa = 7.2DD252 pKa = 3.6HH253 pKa = 7.0FFGGVSVSFSFF264 pKa = 4.63
MM1 pKa = 7.36GGARR5 pKa = 11.84RR6 pKa = 11.84IWVVLGFVVFGLWLLAGGVRR26 pKa = 11.84AEE28 pKa = 4.13EE29 pKa = 4.48AKK31 pKa = 10.52PSADD35 pKa = 3.14FTVDD39 pKa = 3.23VLSQYY44 pKa = 7.35VWRR47 pKa = 11.84GFGLSDD53 pKa = 4.17DD54 pKa = 4.3SVVIQPSMTVSYY66 pKa = 10.76LGAYY70 pKa = 8.55VNLWGNYY77 pKa = 7.82DD78 pKa = 3.66TDD80 pKa = 3.84EE81 pKa = 5.25KK82 pKa = 11.38GSDD85 pKa = 3.23DD86 pKa = 4.63ANWNEE91 pKa = 3.76TDD93 pKa = 3.66FTFGYY98 pKa = 9.17TYY100 pKa = 11.29DD101 pKa = 3.63KK102 pKa = 10.96LPYY105 pKa = 10.54GMSLDD110 pKa = 3.59VGGIYY115 pKa = 10.26YY116 pKa = 10.78ALDD119 pKa = 4.8GIDD122 pKa = 5.12DD123 pKa = 4.08SFEE126 pKa = 4.22LFAGLSATCPKK137 pKa = 10.18TGINFGLTIYY147 pKa = 10.49RR148 pKa = 11.84EE149 pKa = 4.03LSHH152 pKa = 7.15YY153 pKa = 10.11PGTWYY158 pKa = 10.08EE159 pKa = 3.97LSAGRR164 pKa = 11.84DD165 pKa = 3.75FGLPWYY171 pKa = 10.01KK172 pKa = 10.19ATLSLSASAMYY183 pKa = 10.5LDD185 pKa = 4.99SDD187 pKa = 5.02DD188 pKa = 4.23KK189 pKa = 11.47GAYY192 pKa = 8.15PDD194 pKa = 4.7PDD196 pKa = 3.96DD197 pKa = 5.54PNDD200 pKa = 3.73EE201 pKa = 4.29FSGWLYY207 pKa = 10.66LQLGAEE213 pKa = 4.29VSVPVGRR220 pKa = 11.84YY221 pKa = 6.75FTVTPKK227 pKa = 10.51VYY229 pKa = 10.81YY230 pKa = 10.41SFSLSDD236 pKa = 4.13DD237 pKa = 3.85ADD239 pKa = 3.93DD240 pKa = 5.98LIEE243 pKa = 5.25DD244 pKa = 4.45GSWDD248 pKa = 3.38NHH250 pKa = 5.93HH251 pKa = 7.2DD252 pKa = 3.6HH253 pKa = 7.0FFGGVSVSFSFF264 pKa = 4.63
Molecular weight: 29.3 kDa
Isoelectric point according different methods:
Protein with the highest isoelectric point:
>tr|A0A179D6P6|A0A179D6P6_9BACT Uncharacterized protein OS=Thermosulfurimonas dismutans OX=999894 GN=TDIS_0283 PE=4 SV=1
MM1 pKa = 7.35KK2 pKa = 9.4RR3 pKa = 11.84TYY5 pKa = 9.91QPSRR9 pKa = 11.84IKK11 pKa = 10.5RR12 pKa = 11.84KK13 pKa = 8.27RR14 pKa = 11.84CHH16 pKa = 5.7GFRR19 pKa = 11.84ARR21 pKa = 11.84MSSRR25 pKa = 11.84SGRR28 pKa = 11.84KK29 pKa = 8.17ILKK32 pKa = 8.31NRR34 pKa = 11.84RR35 pKa = 11.84RR36 pKa = 11.84KK37 pKa = 9.71GRR39 pKa = 11.84WRR41 pKa = 11.84LTVV44 pKa = 3.0
MM1 pKa = 7.35KK2 pKa = 9.4RR3 pKa = 11.84TYY5 pKa = 9.91QPSRR9 pKa = 11.84IKK11 pKa = 10.5RR12 pKa = 11.84KK13 pKa = 8.27RR14 pKa = 11.84CHH16 pKa = 5.7GFRR19 pKa = 11.84ARR21 pKa = 11.84MSSRR25 pKa = 11.84SGRR28 pKa = 11.84KK29 pKa = 8.17ILKK32 pKa = 8.31NRR34 pKa = 11.84RR35 pKa = 11.84RR36 pKa = 11.84KK37 pKa = 9.71GRR39 pKa = 11.84WRR41 pKa = 11.84LTVV44 pKa = 3.0
Molecular weight: 5.5 kDa
Isoelectric point according different methods:
Peptides (in silico digests for buttom-up proteomics)
Below you can find in silico digests of the whole proteome with Trypsin, Chymotrypsin, Trypsin+LysC, LysN, ArgC proteases suitable for different mass spec machines.| Try ESI |
 |
|---|
| ChTry ESI |
 |
|---|
| ArgC ESI |
 |
|---|
| LysN ESI |
 |
|---|
| TryLysC ESI |
 |
|---|
| Try MALDI |
 |
|---|
| ChTry MALDI |
 |
|---|
| ArgC MALDI |
 |
|---|
| LysN MALDI |
 |
|---|
| TryLysC MALDI |
 |
|---|
| Try LTQ |
 |
|---|
| ChTry LTQ |
 |
|---|
| ArgC LTQ |
 |
|---|
| LysN LTQ |
 |
|---|
| TryLysC LTQ |
 |
|---|
| Try MSlow |
 |
|---|
| ChTry MSlow |
 |
|---|
| ArgC MSlow |
 |
|---|
| LysN MSlow |
 |
|---|
| TryLysC MSlow |
 |
|---|
| Try MShigh |
 |
|---|
| ChTry MShigh |
 |
|---|
| ArgC MShigh |
 |
|---|
| LysN MShigh |
 |
|---|
| TryLysC MShigh |
 |
|---|
General Statistics
Number of major isoforms |
Number of additional isoforms |
Number of all proteins |
Number of amino acids |
Min. Seq. Length |
Max. Seq. Length |
Avg. Seq. Length |
Avg. Mol. Weight |
|---|---|---|---|---|---|---|---|
0 |
655638 |
37 |
1895 |
304.0 |
34.32 |
Amino acid frequency
Ala |
Cys |
Asp |
Glu |
Phe |
Gly |
His |
Ile |
Lys |
Leu |
|---|---|---|---|---|---|---|---|---|---|
7.672 ± 0.057 | 1.063 ± 0.025 |
4.108 ± 0.043 | 8.901 ± 0.067 |
4.867 ± 0.044 | 7.308 ± 0.049 |
1.797 ± 0.024 | 6.035 ± 0.049 |
6.385 ± 0.06 | 12.026 ± 0.077 |
Met |
Asn |
Gln |
Pro |
Arg |
Ser |
Thr |
Val |
Trp |
Tyr |
|---|---|---|---|---|---|---|---|---|---|
1.773 ± 0.02 | 2.601 ± 0.032 |
5.116 ± 0.035 | 2.402 ± 0.029 |
7.024 ± 0.05 | 5.089 ± 0.036 |
4.23 ± 0.035 | 7.127 ± 0.044 |
1.177 ± 0.023 | 3.298 ± 0.031 |
Most of the basic statistics you can see at this page can be downloaded from this CSV file
Proteome-pI is available under Creative Commons Attribution-NoDerivs license, for more details see here
| Reference: Kozlowski LP. Proteome-pI 2.0: Proteome Isoelectric Point Database Update. Nucleic Acids Res. 2021, doi: 10.1093/nar/gkab944 | Contact: Lukasz P. Kozlowski |
