Ignavibacterium album (strain DSM 19864 / JCM 16511 / NBRC 101810 / Mat9-16)
Taxonomy: cellular organisms; Bacteria; FCB group; Bacteroidetes/Chlorobi group; Ignavibacteriae; Ignavibacteria; Ignavibacteriales; Ignavibacteriaceae; Ignavibacterium; Ignavibacterium album
Average proteome isoelectric point is 6.67
Get precalculated fractions of proteins

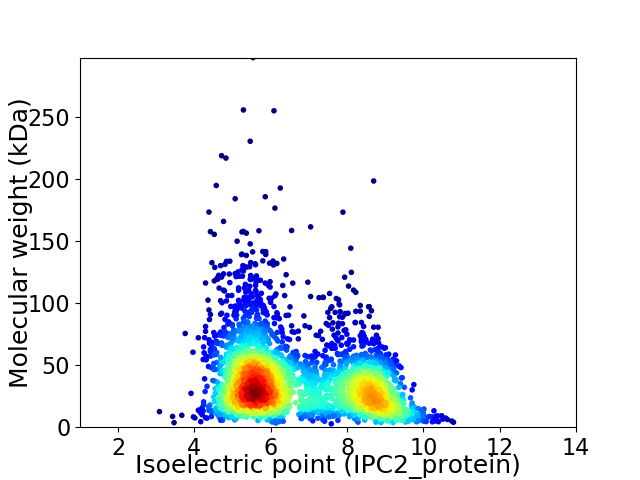
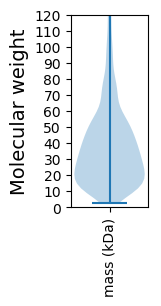
Virtual 2D-PAGE plot for 3169 proteins (isoelectric point calculated using IPC2_protein)
Get csv file with sequences according to given criteria:
* You can choose from 21 different methods for calculating isoelectric point
Summary statistics related to proteome-wise predictions


Protein with the lowest isoelectric point:
>tr|I0AIB4|I0AIB4_IGNAJ Uncharacterized protein OS=Ignavibacterium album (strain DSM 19864 / JCM 16511 / NBRC 101810 / Mat9-16) OX=945713 GN=IALB_1010 PE=4 SV=1
MM1 pKa = 7.5KK2 pKa = 10.55FINLYY7 pKa = 9.73IAILIITTSANAEE20 pKa = 4.0VDD22 pKa = 3.37SLTIIRR28 pKa = 11.84KK29 pKa = 9.34DD30 pKa = 3.84FYY32 pKa = 11.1QATDD36 pKa = 3.36DD37 pKa = 3.32TSAYY41 pKa = 10.79VKK43 pKa = 10.22ILYY46 pKa = 8.4PQINGLDD53 pKa = 3.52NPEE56 pKa = 3.99VQKK59 pKa = 10.93KK60 pKa = 9.96INSFLEE66 pKa = 4.3TEE68 pKa = 4.64FMQAKK73 pKa = 9.44SWFDD77 pKa = 3.7DD78 pKa = 4.61FVADD82 pKa = 3.62TDD84 pKa = 4.13YY85 pKa = 11.44TSEE88 pKa = 4.89FPPDD92 pKa = 2.99WVFSFEE98 pKa = 3.82TDD100 pKa = 3.74FNVTYY105 pKa = 11.05NSIEE109 pKa = 4.02FLSIVLNYY117 pKa = 10.77YY118 pKa = 9.9EE119 pKa = 4.44FTGGAHH125 pKa = 6.0GNYY128 pKa = 9.89YY129 pKa = 10.46SVGYY133 pKa = 10.0NIRR136 pKa = 11.84TSDD139 pKa = 4.05GEE141 pKa = 4.4VLILPDD147 pKa = 3.34ILKK150 pKa = 10.37PNSLQALSEE159 pKa = 4.24FCTEE163 pKa = 4.55EE164 pKa = 3.92ILNMFDD170 pKa = 4.5ANSLNEE176 pKa = 3.99AGLFEE181 pKa = 5.64DD182 pKa = 4.99EE183 pKa = 5.64LNISDD188 pKa = 5.14DD189 pKa = 3.34QDD191 pKa = 4.37FYY193 pKa = 10.83ITPDD197 pKa = 3.36ALVLQFDD204 pKa = 4.5PYY206 pKa = 10.78EE207 pKa = 4.16IAPYY211 pKa = 11.15AMGSIDD217 pKa = 4.41VEE219 pKa = 4.54LKK221 pKa = 10.12FSKK224 pKa = 10.17IKK226 pKa = 10.92NILKK230 pKa = 10.4EE231 pKa = 3.93NLPFLNRR238 pKa = 3.63
MM1 pKa = 7.5KK2 pKa = 10.55FINLYY7 pKa = 9.73IAILIITTSANAEE20 pKa = 4.0VDD22 pKa = 3.37SLTIIRR28 pKa = 11.84KK29 pKa = 9.34DD30 pKa = 3.84FYY32 pKa = 11.1QATDD36 pKa = 3.36DD37 pKa = 3.32TSAYY41 pKa = 10.79VKK43 pKa = 10.22ILYY46 pKa = 8.4PQINGLDD53 pKa = 3.52NPEE56 pKa = 3.99VQKK59 pKa = 10.93KK60 pKa = 9.96INSFLEE66 pKa = 4.3TEE68 pKa = 4.64FMQAKK73 pKa = 9.44SWFDD77 pKa = 3.7DD78 pKa = 4.61FVADD82 pKa = 3.62TDD84 pKa = 4.13YY85 pKa = 11.44TSEE88 pKa = 4.89FPPDD92 pKa = 2.99WVFSFEE98 pKa = 3.82TDD100 pKa = 3.74FNVTYY105 pKa = 11.05NSIEE109 pKa = 4.02FLSIVLNYY117 pKa = 10.77YY118 pKa = 9.9EE119 pKa = 4.44FTGGAHH125 pKa = 6.0GNYY128 pKa = 9.89YY129 pKa = 10.46SVGYY133 pKa = 10.0NIRR136 pKa = 11.84TSDD139 pKa = 4.05GEE141 pKa = 4.4VLILPDD147 pKa = 3.34ILKK150 pKa = 10.37PNSLQALSEE159 pKa = 4.24FCTEE163 pKa = 4.55EE164 pKa = 3.92ILNMFDD170 pKa = 4.5ANSLNEE176 pKa = 3.99AGLFEE181 pKa = 5.64DD182 pKa = 4.99EE183 pKa = 5.64LNISDD188 pKa = 5.14DD189 pKa = 3.34QDD191 pKa = 4.37FYY193 pKa = 10.83ITPDD197 pKa = 3.36ALVLQFDD204 pKa = 4.5PYY206 pKa = 10.78EE207 pKa = 4.16IAPYY211 pKa = 11.15AMGSIDD217 pKa = 4.41VEE219 pKa = 4.54LKK221 pKa = 10.12FSKK224 pKa = 10.17IKK226 pKa = 10.92NILKK230 pKa = 10.4EE231 pKa = 3.93NLPFLNRR238 pKa = 3.63
Molecular weight: 27.31 kDa
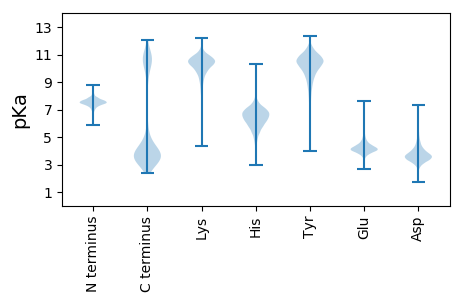
Isoelectric point according different methods:
Protein with the highest isoelectric point:
>tr|I0ALU3|I0ALU3_IGNAJ Serine phosphatase RsbU OS=Ignavibacterium album (strain DSM 19864 / JCM 16511 / NBRC 101810 / Mat9-16) OX=945713 GN=IALB_2247 PE=4 SV=1
MM1 pKa = 7.32PCGRR5 pKa = 11.84KK6 pKa = 9.29RR7 pKa = 11.84KK8 pKa = 6.92RR9 pKa = 11.84HH10 pKa = 5.04KK11 pKa = 10.06MATHH15 pKa = 6.02KK16 pKa = 10.34RR17 pKa = 11.84KK18 pKa = 9.84KK19 pKa = 9.28RR20 pKa = 11.84LRR22 pKa = 11.84KK23 pKa = 9.16NRR25 pKa = 11.84HH26 pKa = 4.6KK27 pKa = 10.96KK28 pKa = 10.03KK29 pKa = 10.26IRR31 pKa = 3.43
MM1 pKa = 7.32PCGRR5 pKa = 11.84KK6 pKa = 9.29RR7 pKa = 11.84KK8 pKa = 6.92RR9 pKa = 11.84HH10 pKa = 5.04KK11 pKa = 10.06MATHH15 pKa = 6.02KK16 pKa = 10.34RR17 pKa = 11.84KK18 pKa = 9.84KK19 pKa = 9.28RR20 pKa = 11.84LRR22 pKa = 11.84KK23 pKa = 9.16NRR25 pKa = 11.84HH26 pKa = 4.6KK27 pKa = 10.96KK28 pKa = 10.03KK29 pKa = 10.26IRR31 pKa = 3.43
Molecular weight: 3.99 kDa
Isoelectric point according different methods:
Peptides (in silico digests for buttom-up proteomics)
Below you can find in silico digests of the whole proteome with Trypsin, Chymotrypsin, Trypsin+LysC, LysN, ArgC proteases suitable for different mass spec machines.| Try ESI |
 |
|---|
| ChTry ESI |
 |
|---|
| ArgC ESI |
 |
|---|
| LysN ESI |
 |
|---|
| TryLysC ESI |
 |
|---|
| Try MALDI |
 |
|---|
| ChTry MALDI |
 |
|---|
| ArgC MALDI |
 |
|---|
| LysN MALDI |
 |
|---|
| TryLysC MALDI |
 |
|---|
| Try LTQ |
 |
|---|
| ChTry LTQ |
 |
|---|
| ArgC LTQ |
 |
|---|
| LysN LTQ |
 |
|---|
| TryLysC LTQ |
 |
|---|
| Try MSlow |
 |
|---|
| ChTry MSlow |
 |
|---|
| ArgC MSlow |
 |
|---|
| LysN MSlow |
 |
|---|
| TryLysC MSlow |
 |
|---|
| Try MShigh |
 |
|---|
| ChTry MShigh |
 |
|---|
| ArgC MShigh |
 |
|---|
| LysN MShigh |
 |
|---|
| TryLysC MShigh |
 |
|---|
General Statistics
Number of major isoforms |
Number of additional isoforms |
Number of all proteins |
Number of amino acids |
Min. Seq. Length |
Max. Seq. Length |
Avg. Seq. Length |
Avg. Mol. Weight |
|---|---|---|---|---|---|---|---|
0 |
1115965 |
22 |
2657 |
352.2 |
39.89 |
Amino acid frequency
Ala |
Cys |
Asp |
Glu |
Phe |
Gly |
His |
Ile |
Lys |
Leu |
|---|---|---|---|---|---|---|---|---|---|
5.752 ± 0.04 | 0.708 ± 0.015 |
5.365 ± 0.033 | 6.652 ± 0.043 |
5.644 ± 0.039 | 6.218 ± 0.039 |
1.462 ± 0.018 | 8.884 ± 0.05 |
7.901 ± 0.043 | 9.47 ± 0.042 |
Met |
Asn |
Gln |
Pro |
Arg |
Ser |
Thr |
Val |
Trp |
Tyr |
|---|---|---|---|---|---|---|---|---|---|
1.902 ± 0.019 | 6.189 ± 0.04 |
3.642 ± 0.025 | 3.079 ± 0.024 |
3.718 ± 0.026 | 6.894 ± 0.04 |
5.214 ± 0.034 | 6.131 ± 0.033 |
1.04 ± 0.018 | 4.135 ± 0.031 |
Most of the basic statistics you can see at this page can be downloaded from this CSV file
Proteome-pI is available under Creative Commons Attribution-NoDerivs license, for more details see here
| Reference: Kozlowski LP. Proteome-pI 2.0: Proteome Isoelectric Point Database Update. Nucleic Acids Res. 2021, doi: 10.1093/nar/gkab944 | Contact: Lukasz P. Kozlowski |
