Actinidia chinensis var. chinensis (Chinese soft-hair kiwi)
Taxonomy: cellular organisms; Eukaryota; Viridiplantae; Streptophyta; Streptophytina; Embryophyta; Tracheophyta; Euphyllophyta; Spermatophyta; Magnoliopsida; Mesangiospermae; eudicotyledons; Gunneridae; Pentapetalae; asterids; Ericales; Actinidiaceae; Actinidia; Actinidia chinensis
Average proteome isoelectric point is 6.71
Get precalculated fractions of proteins

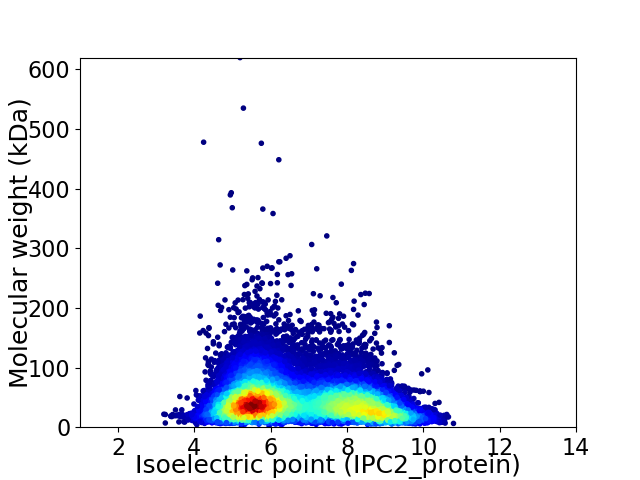
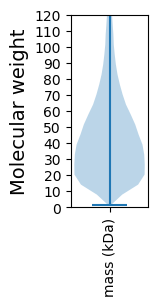
Virtual 2D-PAGE plot for 32913 proteins (isoelectric point calculated using IPC2_protein)
Get csv file with sequences according to given criteria:
* You can choose from 21 different methods for calculating isoelectric point
Summary statistics related to proteome-wise predictions


Protein with the lowest isoelectric point:
>tr|A0A2R6PPN1|A0A2R6PPN1_ACTCC ZZ-type zinc finger-containing protein OS=Actinidia chinensis var. chinensis OX=1590841 GN=CEY00_Acc25744 PE=4 SV=1
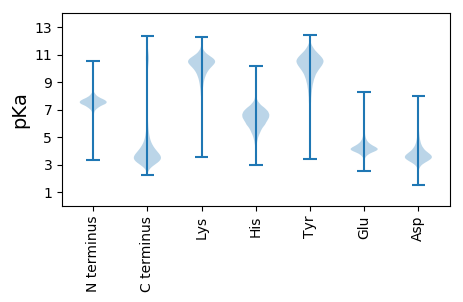
MM1 pKa = 7.75GDD3 pKa = 3.51SEE5 pKa = 4.84TVVAQTSAVMGYY17 pKa = 8.2TSAGYY22 pKa = 10.69SSTNYY27 pKa = 10.48SSISSNVASDD37 pKa = 3.57AGAFADD43 pKa = 3.7ATTTRR48 pKa = 11.84DD49 pKa = 3.05LVAAVAVADD58 pKa = 4.0VANTVADD65 pKa = 4.2GSDD68 pKa = 3.39VGGEE72 pKa = 4.11AYY74 pKa = 8.93STYY77 pKa = 10.83SNSAIQGAPATMLYY91 pKa = 10.79GSDD94 pKa = 3.79GVDD97 pKa = 2.94AMEE100 pKa = 5.6NIAASTKK107 pKa = 10.04ISTGSSQVTGADD119 pKa = 3.08SSVNGNDD126 pKa = 3.14VIEE129 pKa = 4.59ARR131 pKa = 11.84DD132 pKa = 3.49IVLTGISKK140 pKa = 10.6NGNSSDD146 pKa = 3.59KK147 pKa = 10.44VHH149 pKa = 6.66EE150 pKa = 4.58SSSDD154 pKa = 3.32HH155 pKa = 5.94QLVNGSS161 pKa = 3.39
MM1 pKa = 7.75GDD3 pKa = 3.51SEE5 pKa = 4.84TVVAQTSAVMGYY17 pKa = 8.2TSAGYY22 pKa = 10.69SSTNYY27 pKa = 10.48SSISSNVASDD37 pKa = 3.57AGAFADD43 pKa = 3.7ATTTRR48 pKa = 11.84DD49 pKa = 3.05LVAAVAVADD58 pKa = 4.0VANTVADD65 pKa = 4.2GSDD68 pKa = 3.39VGGEE72 pKa = 4.11AYY74 pKa = 8.93STYY77 pKa = 10.83SNSAIQGAPATMLYY91 pKa = 10.79GSDD94 pKa = 3.79GVDD97 pKa = 2.94AMEE100 pKa = 5.6NIAASTKK107 pKa = 10.04ISTGSSQVTGADD119 pKa = 3.08SSVNGNDD126 pKa = 3.14VIEE129 pKa = 4.59ARR131 pKa = 11.84DD132 pKa = 3.49IVLTGISKK140 pKa = 10.6NGNSSDD146 pKa = 3.59KK147 pKa = 10.44VHH149 pKa = 6.66EE150 pKa = 4.58SSSDD154 pKa = 3.32HH155 pKa = 5.94QLVNGSS161 pKa = 3.39
Molecular weight: 15.98 kDa
Isoelectric point according different methods:
Protein with the highest isoelectric point:
>tr|A0A2R6R1C9|A0A2R6R1C9_ACTCC DNA mismatch repair protein like OS=Actinidia chinensis var. chinensis OX=1590841 GN=CEY00_Acc10995 PE=4 SV=1
MM1 pKa = 7.68KK2 pKa = 10.39LPYY5 pKa = 9.61EE6 pKa = 4.23PQHH9 pKa = 6.49RR10 pKa = 11.84GFMTQIYY17 pKa = 9.59DD18 pKa = 3.72LGSRR22 pKa = 11.84TQAPNTLTLAPTSPSLVVHH41 pKa = 6.44RR42 pKa = 11.84HH43 pKa = 4.4HH44 pKa = 6.85HH45 pKa = 5.21HH46 pKa = 6.38TPTVINSNTNIQPPLEE62 pKa = 4.18VATPKK67 pKa = 10.4TSMVVGLLRR76 pKa = 11.84WGLGFNGGMVMRR88 pKa = 11.84FAIPVAVVQFMTAATRR104 pKa = 11.84IKK106 pKa = 10.19RR107 pKa = 11.84QQLDD111 pKa = 3.53SRR113 pKa = 11.84WRR115 pKa = 11.84RR116 pKa = 11.84RR117 pKa = 11.84RR118 pKa = 11.84LNSNGNYY125 pKa = 9.05SRR127 pKa = 11.84HH128 pKa = 5.67PVRR131 pKa = 11.84ICAFCEE137 pKa = 4.24CEE139 pKa = 3.92FQEE142 pKa = 5.94DD143 pKa = 3.54IGDD146 pKa = 4.19EE147 pKa = 3.68IAAIKK152 pKa = 9.33VRR154 pKa = 11.84KK155 pKa = 9.92SGVCRR160 pKa = 11.84RR161 pKa = 11.84IFLLCTPP168 pKa = 5.05
MM1 pKa = 7.68KK2 pKa = 10.39LPYY5 pKa = 9.61EE6 pKa = 4.23PQHH9 pKa = 6.49RR10 pKa = 11.84GFMTQIYY17 pKa = 9.59DD18 pKa = 3.72LGSRR22 pKa = 11.84TQAPNTLTLAPTSPSLVVHH41 pKa = 6.44RR42 pKa = 11.84HH43 pKa = 4.4HH44 pKa = 6.85HH45 pKa = 5.21HH46 pKa = 6.38TPTVINSNTNIQPPLEE62 pKa = 4.18VATPKK67 pKa = 10.4TSMVVGLLRR76 pKa = 11.84WGLGFNGGMVMRR88 pKa = 11.84FAIPVAVVQFMTAATRR104 pKa = 11.84IKK106 pKa = 10.19RR107 pKa = 11.84QQLDD111 pKa = 3.53SRR113 pKa = 11.84WRR115 pKa = 11.84RR116 pKa = 11.84RR117 pKa = 11.84RR118 pKa = 11.84LNSNGNYY125 pKa = 9.05SRR127 pKa = 11.84HH128 pKa = 5.67PVRR131 pKa = 11.84ICAFCEE137 pKa = 4.24CEE139 pKa = 3.92FQEE142 pKa = 5.94DD143 pKa = 3.54IGDD146 pKa = 4.19EE147 pKa = 3.68IAAIKK152 pKa = 9.33VRR154 pKa = 11.84KK155 pKa = 9.92SGVCRR160 pKa = 11.84RR161 pKa = 11.84IFLLCTPP168 pKa = 5.05
Molecular weight: 19.08 kDa
Isoelectric point according different methods:
Peptides (in silico digests for buttom-up proteomics)
Below you can find in silico digests of the whole proteome with Trypsin, Chymotrypsin, Trypsin+LysC, LysN, ArgC proteases suitable for different mass spec machines.| Try ESI |
 |
|---|
| ChTry ESI |
 |
|---|
| ArgC ESI |
 |
|---|
| LysN ESI |
 |
|---|
| TryLysC ESI |
 |
|---|
| Try MALDI |
 |
|---|
| ChTry MALDI |
 |
|---|
| ArgC MALDI |
 |
|---|
| LysN MALDI |
 |
|---|
| TryLysC MALDI |
 |
|---|
| Try LTQ |
 |
|---|
| ChTry LTQ |
 |
|---|
| ArgC LTQ |
 |
|---|
| LysN LTQ |
 |
|---|
| TryLysC LTQ |
 |
|---|
| Try MSlow |
 |
|---|
| ChTry MSlow |
 |
|---|
| ArgC MSlow |
 |
|---|
| LysN MSlow |
 |
|---|
| TryLysC MSlow |
 |
|---|
| Try MShigh |
 |
|---|
| ChTry MShigh |
 |
|---|
| ArgC MShigh |
 |
|---|
| LysN MShigh |
 |
|---|
| TryLysC MShigh |
 |
|---|
General Statistics
Number of major isoforms |
Number of additional isoforms |
Number of all proteins |
Number of amino acids |
Min. Seq. Length |
Max. Seq. Length |
Avg. Seq. Length |
Avg. Mol. Weight |
|---|---|---|---|---|---|---|---|
14039321 |
13 |
5453 |
426.6 |
47.52 |
Amino acid frequency
Ala |
Cys |
Asp |
Glu |
Phe |
Gly |
His |
Ile |
Lys |
Leu |
|---|---|---|---|---|---|---|---|---|---|
6.781 ± 0.012 | 1.841 ± 0.007 |
5.304 ± 0.008 | 6.526 ± 0.014 |
4.143 ± 0.008 | 6.742 ± 0.013 |
2.389 ± 0.006 | 5.171 ± 0.008 |
5.969 ± 0.011 | 9.586 ± 0.017 |
Met |
Asn |
Gln |
Pro |
Arg |
Ser |
Thr |
Val |
Trp |
Tyr |
|---|---|---|---|---|---|---|---|---|---|
2.423 ± 0.005 | 4.383 ± 0.008 |
5.098 ± 0.014 | 3.674 ± 0.009 |
5.459 ± 0.01 | 9.017 ± 0.014 |
4.891 ± 0.009 | 6.592 ± 0.009 |
1.276 ± 0.004 | 2.736 ± 0.007 |
Most of the basic statistics you can see at this page can be downloaded from this CSV file
Proteome-pI is available under Creative Commons Attribution-NoDerivs license, for more details see here
| Reference: Kozlowski LP. Proteome-pI 2.0: Proteome Isoelectric Point Database Update. Nucleic Acids Res. 2021, doi: 10.1093/nar/gkab944 | Contact: Lukasz P. Kozlowski |
