Beet soil-borne virus
Taxonomy: Viruses; Riboviria; Orthornavirae; Kitrinoviricota; Alsuviricetes; Martellivirales; Virgaviridae; Pomovirus
Average proteome isoelectric point is 6.34
Get precalculated fractions of proteins

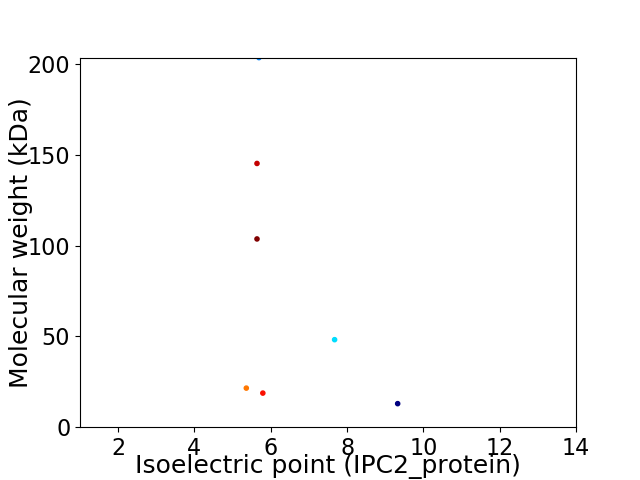
Virtual 2D-PAGE plot for 7 proteins (isoelectric point calculated using IPC2_protein)
Get csv file with sequences according to given criteria:
* You can choose from 21 different methods for calculating isoelectric point
Summary statistics related to proteome-wise predictions


Protein with the lowest isoelectric point:
>tr|Q65728|Q65728_9VIRU 22K protein OS=Beet soil-borne virus OX=46436 PE=4 SV=1
MM1 pKa = 8.06DD2 pKa = 5.46PPAIIHH8 pKa = 5.92SQNCCCPDD16 pKa = 4.14CSWQPSCTHH25 pKa = 6.44TSNTEE30 pKa = 3.88SLNARR35 pKa = 11.84SPVEE39 pKa = 3.79EE40 pKa = 4.01NVRR43 pKa = 11.84MVKK46 pKa = 10.3GYY48 pKa = 8.41STDD51 pKa = 3.64YY52 pKa = 11.34VIMCVIVSVSLGFAIAAYY70 pKa = 8.95FYY72 pKa = 11.14SSGGHH77 pKa = 5.96YY78 pKa = 10.84DD79 pKa = 3.1PDD81 pKa = 3.51AAIFKK86 pKa = 10.25QDD88 pKa = 3.58LNEE91 pKa = 3.9VQINFGKK98 pKa = 10.24HH99 pKa = 5.58PIDD102 pKa = 3.83PKK104 pKa = 10.59VIEE107 pKa = 5.1AVHH110 pKa = 5.77HH111 pKa = 5.12WQRR114 pKa = 11.84APFGRR119 pKa = 11.84FQGEE123 pKa = 4.29SVDD126 pKa = 3.43VSKK129 pKa = 11.51NFFEE133 pKa = 5.79DD134 pKa = 4.42SVDD137 pKa = 3.57EE138 pKa = 4.61DD139 pKa = 4.34DD140 pKa = 3.95EE141 pKa = 4.53EE142 pKa = 4.6EE143 pKa = 3.87RR144 pKa = 11.84AEE146 pKa = 4.17VNKK149 pKa = 10.99EE150 pKa = 3.61EE151 pKa = 4.16VTKK154 pKa = 10.72KK155 pKa = 9.42KK156 pKa = 10.94SKK158 pKa = 10.38VAVCNRR164 pKa = 11.84LCSIRR169 pKa = 11.84NSLLRR174 pKa = 11.84LFWVITLIIIVVKK187 pKa = 10.74CRR189 pKa = 11.84FF190 pKa = 3.24
MM1 pKa = 8.06DD2 pKa = 5.46PPAIIHH8 pKa = 5.92SQNCCCPDD16 pKa = 4.14CSWQPSCTHH25 pKa = 6.44TSNTEE30 pKa = 3.88SLNARR35 pKa = 11.84SPVEE39 pKa = 3.79EE40 pKa = 4.01NVRR43 pKa = 11.84MVKK46 pKa = 10.3GYY48 pKa = 8.41STDD51 pKa = 3.64YY52 pKa = 11.34VIMCVIVSVSLGFAIAAYY70 pKa = 8.95FYY72 pKa = 11.14SSGGHH77 pKa = 5.96YY78 pKa = 10.84DD79 pKa = 3.1PDD81 pKa = 3.51AAIFKK86 pKa = 10.25QDD88 pKa = 3.58LNEE91 pKa = 3.9VQINFGKK98 pKa = 10.24HH99 pKa = 5.58PIDD102 pKa = 3.83PKK104 pKa = 10.59VIEE107 pKa = 5.1AVHH110 pKa = 5.77HH111 pKa = 5.12WQRR114 pKa = 11.84APFGRR119 pKa = 11.84FQGEE123 pKa = 4.29SVDD126 pKa = 3.43VSKK129 pKa = 11.51NFFEE133 pKa = 5.79DD134 pKa = 4.42SVDD137 pKa = 3.57EE138 pKa = 4.61DD139 pKa = 4.34DD140 pKa = 3.95EE141 pKa = 4.53EE142 pKa = 4.6EE143 pKa = 3.87RR144 pKa = 11.84AEE146 pKa = 4.17VNKK149 pKa = 10.99EE150 pKa = 3.61EE151 pKa = 4.16VTKK154 pKa = 10.72KK155 pKa = 9.42KK156 pKa = 10.94SKK158 pKa = 10.38VAVCNRR164 pKa = 11.84LCSIRR169 pKa = 11.84NSLLRR174 pKa = 11.84LFWVITLIIIVVKK187 pKa = 10.74CRR189 pKa = 11.84FF190 pKa = 3.24
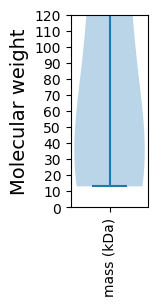
Molecular weight: 21.54 kDa
Isoelectric point according different methods:
Protein with the highest isoelectric point:
>tr|Q65728|Q65728_9VIRU 22K protein OS=Beet soil-borne virus OX=46436 PE=4 SV=1
MM1 pKa = 7.19VRR3 pKa = 11.84TNEE6 pKa = 3.49IGARR10 pKa = 11.84PNKK13 pKa = 9.13YY14 pKa = 7.88WPIVVGVFAIALFSFLTITNQKK36 pKa = 9.73HH37 pKa = 4.12ATEE40 pKa = 4.67SGDD43 pKa = 3.87NIHH46 pKa = 6.77KK47 pKa = 10.2FSNGGKK53 pKa = 9.42FQDD56 pKa = 3.56GNKK59 pKa = 9.16RR60 pKa = 11.84VHH62 pKa = 6.03YY63 pKa = 10.22NKK65 pKa = 10.32NNPRR69 pKa = 11.84AYY71 pKa = 10.44NGSSSNNTFSKK82 pKa = 10.89LLLPGLFLAAIMYY95 pKa = 10.16AYY97 pKa = 9.84VQYY100 pKa = 10.7RR101 pKa = 11.84KK102 pKa = 8.75PQCTVTCRR110 pKa = 11.84GEE112 pKa = 4.18CAHH115 pKa = 6.8GG116 pKa = 3.49
MM1 pKa = 7.19VRR3 pKa = 11.84TNEE6 pKa = 3.49IGARR10 pKa = 11.84PNKK13 pKa = 9.13YY14 pKa = 7.88WPIVVGVFAIALFSFLTITNQKK36 pKa = 9.73HH37 pKa = 4.12ATEE40 pKa = 4.67SGDD43 pKa = 3.87NIHH46 pKa = 6.77KK47 pKa = 10.2FSNGGKK53 pKa = 9.42FQDD56 pKa = 3.56GNKK59 pKa = 9.16RR60 pKa = 11.84VHH62 pKa = 6.03YY63 pKa = 10.22NKK65 pKa = 10.32NNPRR69 pKa = 11.84AYY71 pKa = 10.44NGSSSNNTFSKK82 pKa = 10.89LLLPGLFLAAIMYY95 pKa = 10.16AYY97 pKa = 9.84VQYY100 pKa = 10.7RR101 pKa = 11.84KK102 pKa = 8.75PQCTVTCRR110 pKa = 11.84GEE112 pKa = 4.18CAHH115 pKa = 6.8GG116 pKa = 3.49
Molecular weight: 12.97 kDa
Isoelectric point according different methods:
Peptides (in silico digests for buttom-up proteomics)
Below you can find in silico digests of the whole proteome with Trypsin, Chymotrypsin, Trypsin+LysC, LysN, ArgC proteases suitable for different mass spec machines.| Try ESI |
 |
|---|
| ChTry ESI |
 |
|---|
| ArgC ESI |
 |
|---|
| LysN ESI |
 |
|---|
| TryLysC ESI |
 |
|---|
| Try MALDI |
 |
|---|
| ChTry MALDI |
 |
|---|
| ArgC MALDI |
 |
|---|
| LysN MALDI |
 |
|---|
| TryLysC MALDI |
 |
|---|
| Try LTQ |
 |
|---|
| ChTry LTQ |
 |
|---|
| ArgC LTQ |
 |
|---|
| LysN LTQ |
 |
|---|
| TryLysC LTQ |
 |
|---|
| Try MSlow |
 |
|---|
| ChTry MSlow |
 |
|---|
| ArgC MSlow |
 |
|---|
| LysN MSlow |
 |
|---|
| TryLysC MSlow |
 |
|---|
| Try MShigh |
 |
|---|
| ChTry MShigh |
 |
|---|
| ArgC MShigh |
 |
|---|
| LysN MShigh |
 |
|---|
| TryLysC MShigh |
 |
|---|
General Statistics
Number of major isoforms |
Number of additional isoforms |
Number of all proteins |
Number of amino acids |
Min. Seq. Length |
Max. Seq. Length |
Avg. Seq. Length |
Avg. Mol. Weight |
|---|---|---|---|---|---|---|---|
0 |
4876 |
116 |
1778 |
696.6 |
79.15 |
Amino acid frequency
Ala |
Cys |
Asp |
Glu |
Phe |
Gly |
His |
Ile |
Lys |
Leu |
|---|---|---|---|---|---|---|---|---|---|
6.44 ± 0.467 | 1.887 ± 0.258 |
7.055 ± 0.234 | 7.424 ± 0.282 |
4.573 ± 0.193 | 5.435 ± 0.386 |
1.907 ± 0.301 | 5.558 ± 0.221 |
7.075 ± 0.441 | 8.306 ± 0.451 |
Met |
Asn |
Gln |
Pro |
Arg |
Ser |
Thr |
Val |
Trp |
Tyr |
|---|---|---|---|---|---|---|---|---|---|
2.461 ± 0.295 | 4.82 ± 0.223 |
2.728 ± 0.17 | 2.871 ± 0.222 |
6.44 ± 0.48 | 7.568 ± 0.39 |
5.476 ± 0.263 | 7.465 ± 0.28 |
1.025 ± 0.174 | 3.445 ± 0.345 |
Most of the basic statistics you can see at this page can be downloaded from this CSV file
Proteome-pI is available under Creative Commons Attribution-NoDerivs license, for more details see here
| Reference: Kozlowski LP. Proteome-pI 2.0: Proteome Isoelectric Point Database Update. Nucleic Acids Res. 2021, doi: 10.1093/nar/gkab944 | Contact: Lukasz P. Kozlowski |
