Ponticoccus marisrubri
Taxonomy: cellular organisms; Bacteria; Proteobacteria; Alphaproteobacteria; Rhodobacterales; Roseobacteraceae; Ponticoccus
Average proteome isoelectric point is 6.14
Get precalculated fractions of proteins

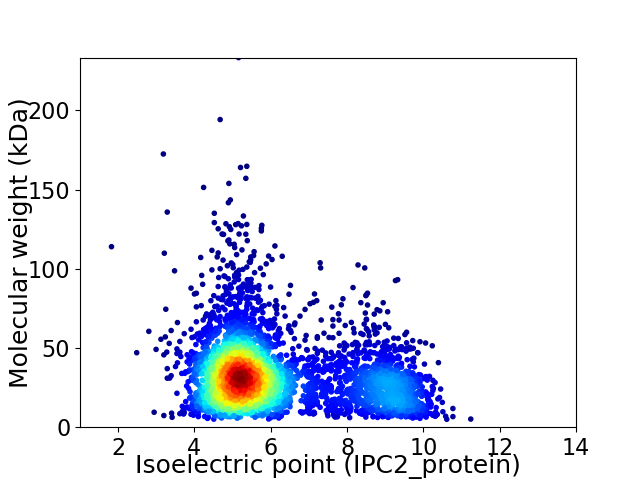
Virtual 2D-PAGE plot for 4264 proteins (isoelectric point calculated using IPC2_protein)
Get csv file with sequences according to given criteria:
* You can choose from 21 different methods for calculating isoelectric point
Summary statistics related to proteome-wise predictions


Protein with the lowest isoelectric point:
>tr|A0A0W7WN60|A0A0W7WN60_9RHOB Uncharacterized protein OS=Ponticoccus marisrubri OX=1685382 GN=AVJ23_05475 PE=4 SV=1
MM1 pKa = 7.53KK2 pKa = 10.44KK3 pKa = 10.44LPLMLAAGAVAAPMAAQAQSDD24 pKa = 4.17GCGEE28 pKa = 4.03VSITEE33 pKa = 4.21MNWASSQVVTSVASFLMQQGYY54 pKa = 8.66GCEE57 pKa = 4.19VNVVSSDD64 pKa = 3.84TIPAITSVAEE74 pKa = 3.92NGEE77 pKa = 3.98PDD79 pKa = 3.41IVTEE83 pKa = 4.39LWLNSTGDD91 pKa = 3.14TYY93 pKa = 11.25TQLKK97 pKa = 9.12EE98 pKa = 3.73AGKK101 pKa = 9.91VVEE104 pKa = 4.7AAPVLDD110 pKa = 4.2PGGVEE115 pKa = 4.41GWWIPTYY122 pKa = 10.38LAEE125 pKa = 4.26EE126 pKa = 4.42HH127 pKa = 7.14PEE129 pKa = 3.8LTTIEE134 pKa = 4.98GILANPEE141 pKa = 3.94LVDD144 pKa = 3.63GRR146 pKa = 11.84FYY148 pKa = 11.26NCPEE152 pKa = 3.46GWGCRR157 pKa = 11.84VVSDD161 pKa = 4.23NLSAALDD168 pKa = 3.78LEE170 pKa = 4.82GNGIEE175 pKa = 4.39VFNSGSGQVLATSMADD191 pKa = 2.78AVLNEE196 pKa = 4.4EE197 pKa = 4.31PWFGYY202 pKa = 9.75YY203 pKa = 9.38WGPTVPLGKK212 pKa = 10.2YY213 pKa = 10.82DD214 pKa = 3.45MTKK217 pKa = 9.95IDD219 pKa = 3.7LGEE222 pKa = 4.15VNEE225 pKa = 5.02EE226 pKa = 3.55IHH228 pKa = 6.63NANQNADD235 pKa = 3.35NDD237 pKa = 4.04NPGVSDD243 pKa = 5.14FPAAPIVTATTTTFQEE259 pKa = 4.4SNPEE263 pKa = 3.9VFALLQNMTFKK274 pKa = 10.51TSDD277 pKa = 3.42MSSVLAWKK285 pKa = 10.35DD286 pKa = 3.44EE287 pKa = 4.34NNASAEE293 pKa = 4.1EE294 pKa = 3.87AAVYY298 pKa = 10.79YY299 pKa = 7.79LTNYY303 pKa = 8.17QDD305 pKa = 4.32EE306 pKa = 4.53WAGWLNDD313 pKa = 3.55AARR316 pKa = 11.84DD317 pKa = 3.88NLSALLSQQ325 pKa = 4.43
MM1 pKa = 7.53KK2 pKa = 10.44KK3 pKa = 10.44LPLMLAAGAVAAPMAAQAQSDD24 pKa = 4.17GCGEE28 pKa = 4.03VSITEE33 pKa = 4.21MNWASSQVVTSVASFLMQQGYY54 pKa = 8.66GCEE57 pKa = 4.19VNVVSSDD64 pKa = 3.84TIPAITSVAEE74 pKa = 3.92NGEE77 pKa = 3.98PDD79 pKa = 3.41IVTEE83 pKa = 4.39LWLNSTGDD91 pKa = 3.14TYY93 pKa = 11.25TQLKK97 pKa = 9.12EE98 pKa = 3.73AGKK101 pKa = 9.91VVEE104 pKa = 4.7AAPVLDD110 pKa = 4.2PGGVEE115 pKa = 4.41GWWIPTYY122 pKa = 10.38LAEE125 pKa = 4.26EE126 pKa = 4.42HH127 pKa = 7.14PEE129 pKa = 3.8LTTIEE134 pKa = 4.98GILANPEE141 pKa = 3.94LVDD144 pKa = 3.63GRR146 pKa = 11.84FYY148 pKa = 11.26NCPEE152 pKa = 3.46GWGCRR157 pKa = 11.84VVSDD161 pKa = 4.23NLSAALDD168 pKa = 3.78LEE170 pKa = 4.82GNGIEE175 pKa = 4.39VFNSGSGQVLATSMADD191 pKa = 2.78AVLNEE196 pKa = 4.4EE197 pKa = 4.31PWFGYY202 pKa = 9.75YY203 pKa = 9.38WGPTVPLGKK212 pKa = 10.2YY213 pKa = 10.82DD214 pKa = 3.45MTKK217 pKa = 9.95IDD219 pKa = 3.7LGEE222 pKa = 4.15VNEE225 pKa = 5.02EE226 pKa = 3.55IHH228 pKa = 6.63NANQNADD235 pKa = 3.35NDD237 pKa = 4.04NPGVSDD243 pKa = 5.14FPAAPIVTATTTTFQEE259 pKa = 4.4SNPEE263 pKa = 3.9VFALLQNMTFKK274 pKa = 10.51TSDD277 pKa = 3.42MSSVLAWKK285 pKa = 10.35DD286 pKa = 3.44EE287 pKa = 4.34NNASAEE293 pKa = 4.1EE294 pKa = 3.87AAVYY298 pKa = 10.79YY299 pKa = 7.79LTNYY303 pKa = 8.17QDD305 pKa = 4.32EE306 pKa = 4.53WAGWLNDD313 pKa = 3.55AARR316 pKa = 11.84DD317 pKa = 3.88NLSALLSQQ325 pKa = 4.43
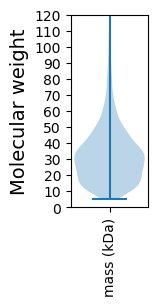
Molecular weight: 34.93 kDa
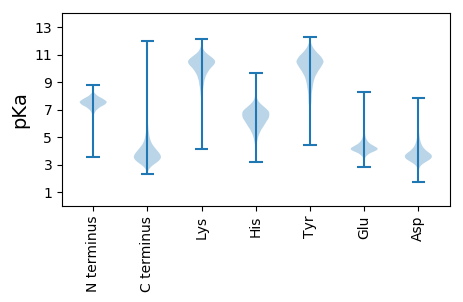
Isoelectric point according different methods:
Protein with the highest isoelectric point:
>tr|A0A0W7WPK4|A0A0W7WPK4_9RHOB 50S ribosomal protein L30 OS=Ponticoccus marisrubri OX=1685382 GN=rpmD PE=3 SV=1
MM1 pKa = 7.45KK2 pKa = 9.61RR3 pKa = 11.84TFQPSNLVRR12 pKa = 11.84KK13 pKa = 9.18RR14 pKa = 11.84RR15 pKa = 11.84HH16 pKa = 4.42GFRR19 pKa = 11.84ARR21 pKa = 11.84MATKK25 pKa = 10.37AGRR28 pKa = 11.84KK29 pKa = 8.54ILNARR34 pKa = 11.84RR35 pKa = 11.84ARR37 pKa = 11.84GRR39 pKa = 11.84KK40 pKa = 9.07SLSAA44 pKa = 3.93
MM1 pKa = 7.45KK2 pKa = 9.61RR3 pKa = 11.84TFQPSNLVRR12 pKa = 11.84KK13 pKa = 9.18RR14 pKa = 11.84RR15 pKa = 11.84HH16 pKa = 4.42GFRR19 pKa = 11.84ARR21 pKa = 11.84MATKK25 pKa = 10.37AGRR28 pKa = 11.84KK29 pKa = 8.54ILNARR34 pKa = 11.84RR35 pKa = 11.84ARR37 pKa = 11.84GRR39 pKa = 11.84KK40 pKa = 9.07SLSAA44 pKa = 3.93
Molecular weight: 5.14 kDa
Isoelectric point according different methods:
Peptides (in silico digests for buttom-up proteomics)
Below you can find in silico digests of the whole proteome with Trypsin, Chymotrypsin, Trypsin+LysC, LysN, ArgC proteases suitable for different mass spec machines.| Try ESI |
 |
|---|
| ChTry ESI |
 |
|---|
| ArgC ESI |
 |
|---|
| LysN ESI |
 |
|---|
| TryLysC ESI |
 |
|---|
| Try MALDI |
 |
|---|
| ChTry MALDI |
 |
|---|
| ArgC MALDI |
 |
|---|
| LysN MALDI |
 |
|---|
| TryLysC MALDI |
 |
|---|
| Try LTQ |
 |
|---|
| ChTry LTQ |
 |
|---|
| ArgC LTQ |
 |
|---|
| LysN LTQ |
 |
|---|
| TryLysC LTQ |
 |
|---|
| Try MSlow |
 |
|---|
| ChTry MSlow |
 |
|---|
| ArgC MSlow |
 |
|---|
| LysN MSlow |
 |
|---|
| TryLysC MSlow |
 |
|---|
| Try MShigh |
 |
|---|
| ChTry MShigh |
 |
|---|
| ArgC MShigh |
 |
|---|
| LysN MShigh |
 |
|---|
| TryLysC MShigh |
 |
|---|
General Statistics
Number of major isoforms |
Number of additional isoforms |
Number of all proteins |
Number of amino acids |
Min. Seq. Length |
Max. Seq. Length |
Avg. Seq. Length |
Avg. Mol. Weight |
|---|---|---|---|---|---|---|---|
0 |
1336786 |
41 |
2158 |
313.5 |
33.95 |
Amino acid frequency
Ala |
Cys |
Asp |
Glu |
Phe |
Gly |
His |
Ile |
Lys |
Leu |
|---|---|---|---|---|---|---|---|---|---|
13.093 ± 0.061 | 0.899 ± 0.012 |
6.137 ± 0.041 | 6.072 ± 0.046 |
3.57 ± 0.022 | 8.934 ± 0.041 |
2.079 ± 0.019 | 4.657 ± 0.03 |
2.468 ± 0.032 | 10.299 ± 0.047 |
Met |
Asn |
Gln |
Pro |
Arg |
Ser |
Thr |
Val |
Trp |
Tyr |
|---|---|---|---|---|---|---|---|---|---|
2.688 ± 0.015 | 2.249 ± 0.024 |
5.438 ± 0.032 | 3.177 ± 0.019 |
7.346 ± 0.044 | 4.664 ± 0.026 |
5.379 ± 0.028 | 7.259 ± 0.033 |
1.449 ± 0.016 | 2.14 ± 0.018 |
Most of the basic statistics you can see at this page can be downloaded from this CSV file
Proteome-pI is available under Creative Commons Attribution-NoDerivs license, for more details see here
| Reference: Kozlowski LP. Proteome-pI 2.0: Proteome Isoelectric Point Database Update. Nucleic Acids Res. 2021, doi: 10.1093/nar/gkab944 | Contact: Lukasz P. Kozlowski |
