Fusobacterium sp. CAG:439
Taxonomy: cellular organisms; Bacteria; Fusobacteria; Fusobacteriia; Fusobacteriales; Fusobacteriaceae; Fusobacterium; environmental samples
Average proteome isoelectric point is 6.65
Get precalculated fractions of proteins

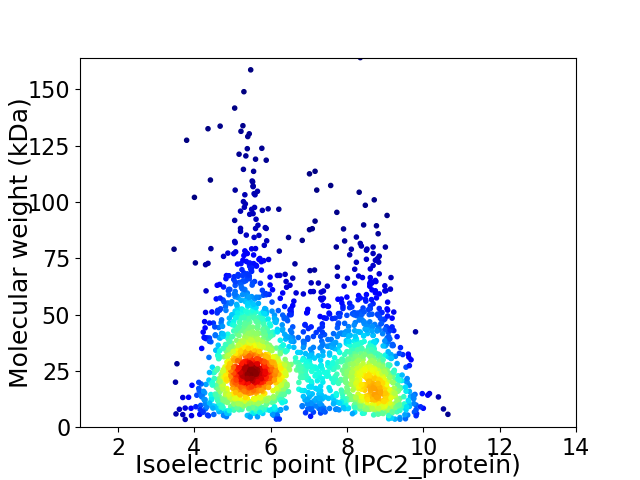
Virtual 2D-PAGE plot for 2311 proteins (isoelectric point calculated using IPC2_protein)
Get csv file with sequences according to given criteria:
* You can choose from 21 different methods for calculating isoelectric point
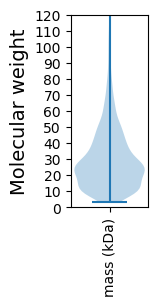
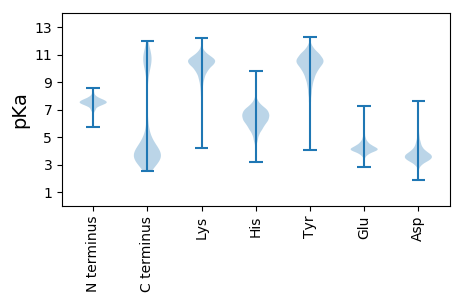
Summary statistics related to proteome-wise predictions


Protein with the lowest isoelectric point:
>tr|R7JE10|R7JE10_9FUSO Transcriptional regulator LuxR family OS=Fusobacterium sp. CAG:439 OX=1262899 GN=BN657_00084 PE=4 SV=1
MM1 pKa = 7.66QYY3 pKa = 10.99QNDD6 pKa = 3.82RR7 pKa = 11.84NAVNLVEE14 pKa = 5.57AGLNSQDD21 pKa = 3.21AANNFIEE28 pKa = 4.91TYY30 pKa = 9.63FKK32 pKa = 11.11VVNKK36 pKa = 10.04CDD38 pKa = 3.7NLSGCFADD46 pKa = 3.84SYY48 pKa = 11.32KK49 pKa = 10.71KK50 pKa = 10.58ISGADD55 pKa = 3.35AGIGDD60 pKa = 3.88YY61 pKa = 10.68SSYY64 pKa = 11.2VIASGAALRR73 pKa = 11.84PAYY76 pKa = 10.53NRR78 pKa = 11.84VDD80 pKa = 3.52DD81 pKa = 4.23SVISFLVDD89 pKa = 3.19VNGKK93 pKa = 9.32QGPNIAGRR101 pKa = 11.84DD102 pKa = 3.77LFIMCLYY109 pKa = 10.73NNGVLDD115 pKa = 4.14DD116 pKa = 4.36ANYY119 pKa = 11.02NIDD122 pKa = 4.59DD123 pKa = 5.21DD124 pKa = 5.14GNTVNFSGAPSEE136 pKa = 4.34EE137 pKa = 3.81EE138 pKa = 4.1RR139 pKa = 11.84NDD141 pKa = 3.8LFNSQCISSNSDD153 pKa = 3.45GISGCFGKK161 pKa = 10.31ILNDD165 pKa = 3.21NWEE168 pKa = 3.95MTYY171 pKa = 11.36
MM1 pKa = 7.66QYY3 pKa = 10.99QNDD6 pKa = 3.82RR7 pKa = 11.84NAVNLVEE14 pKa = 5.57AGLNSQDD21 pKa = 3.21AANNFIEE28 pKa = 4.91TYY30 pKa = 9.63FKK32 pKa = 11.11VVNKK36 pKa = 10.04CDD38 pKa = 3.7NLSGCFADD46 pKa = 3.84SYY48 pKa = 11.32KK49 pKa = 10.71KK50 pKa = 10.58ISGADD55 pKa = 3.35AGIGDD60 pKa = 3.88YY61 pKa = 10.68SSYY64 pKa = 11.2VIASGAALRR73 pKa = 11.84PAYY76 pKa = 10.53NRR78 pKa = 11.84VDD80 pKa = 3.52DD81 pKa = 4.23SVISFLVDD89 pKa = 3.19VNGKK93 pKa = 9.32QGPNIAGRR101 pKa = 11.84DD102 pKa = 3.77LFIMCLYY109 pKa = 10.73NNGVLDD115 pKa = 4.14DD116 pKa = 4.36ANYY119 pKa = 11.02NIDD122 pKa = 4.59DD123 pKa = 5.21DD124 pKa = 5.14GNTVNFSGAPSEE136 pKa = 4.34EE137 pKa = 3.81EE138 pKa = 4.1RR139 pKa = 11.84NDD141 pKa = 3.8LFNSQCISSNSDD153 pKa = 3.45GISGCFGKK161 pKa = 10.31ILNDD165 pKa = 3.21NWEE168 pKa = 3.95MTYY171 pKa = 11.36
Molecular weight: 18.61 kDa
Isoelectric point according different methods:
Protein with the highest isoelectric point:
>tr|R7JEA2|R7JEA2_9FUSO Anhydro-N-acetylmuramic acid kinase OS=Fusobacterium sp. CAG:439 OX=1262899 GN=anmK PE=3 SV=1
MM1 pKa = 7.42ARR3 pKa = 11.84LAGVDD8 pKa = 3.49LPRR11 pKa = 11.84NKK13 pKa = 10.15RR14 pKa = 11.84MEE16 pKa = 3.88IALTYY21 pKa = 9.91IYY23 pKa = 10.66GIGPTRR29 pKa = 11.84AKK31 pKa = 10.41KK32 pKa = 10.38ILDD35 pKa = 3.53ATKK38 pKa = 10.09ISPDD42 pKa = 3.68LRR44 pKa = 11.84TDD46 pKa = 3.54DD47 pKa = 5.08LTDD50 pKa = 3.53EE51 pKa = 5.08DD52 pKa = 4.55IKK54 pKa = 11.3LLRR57 pKa = 11.84NEE59 pKa = 4.02LANYY63 pKa = 9.4HH64 pKa = 6.41IEE66 pKa = 4.36GDD68 pKa = 3.51LRR70 pKa = 11.84RR71 pKa = 11.84EE72 pKa = 4.02VTLHH76 pKa = 6.11IKK78 pKa = 10.22RR79 pKa = 11.84LQEE82 pKa = 3.7IGSYY86 pKa = 9.98RR87 pKa = 11.84GLRR90 pKa = 11.84HH91 pKa = 6.3KK92 pKa = 10.86RR93 pKa = 11.84NLPCRR98 pKa = 11.84GQRR101 pKa = 11.84TKK103 pKa = 10.84TNARR107 pKa = 11.84TRR109 pKa = 11.84RR110 pKa = 11.84GKK112 pKa = 10.45KK113 pKa = 9.91GLAITKK119 pKa = 10.11KK120 pKa = 9.23KK121 pKa = 8.2TAA123 pKa = 3.9
MM1 pKa = 7.42ARR3 pKa = 11.84LAGVDD8 pKa = 3.49LPRR11 pKa = 11.84NKK13 pKa = 10.15RR14 pKa = 11.84MEE16 pKa = 3.88IALTYY21 pKa = 9.91IYY23 pKa = 10.66GIGPTRR29 pKa = 11.84AKK31 pKa = 10.41KK32 pKa = 10.38ILDD35 pKa = 3.53ATKK38 pKa = 10.09ISPDD42 pKa = 3.68LRR44 pKa = 11.84TDD46 pKa = 3.54DD47 pKa = 5.08LTDD50 pKa = 3.53EE51 pKa = 5.08DD52 pKa = 4.55IKK54 pKa = 11.3LLRR57 pKa = 11.84NEE59 pKa = 4.02LANYY63 pKa = 9.4HH64 pKa = 6.41IEE66 pKa = 4.36GDD68 pKa = 3.51LRR70 pKa = 11.84RR71 pKa = 11.84EE72 pKa = 4.02VTLHH76 pKa = 6.11IKK78 pKa = 10.22RR79 pKa = 11.84LQEE82 pKa = 3.7IGSYY86 pKa = 9.98RR87 pKa = 11.84GLRR90 pKa = 11.84HH91 pKa = 6.3KK92 pKa = 10.86RR93 pKa = 11.84NLPCRR98 pKa = 11.84GQRR101 pKa = 11.84TKK103 pKa = 10.84TNARR107 pKa = 11.84TRR109 pKa = 11.84RR110 pKa = 11.84GKK112 pKa = 10.45KK113 pKa = 9.91GLAITKK119 pKa = 10.11KK120 pKa = 9.23KK121 pKa = 8.2TAA123 pKa = 3.9
Molecular weight: 14.15 kDa
Isoelectric point according different methods:
Peptides (in silico digests for buttom-up proteomics)
Below you can find in silico digests of the whole proteome with Trypsin, Chymotrypsin, Trypsin+LysC, LysN, ArgC proteases suitable for different mass spec machines.| Try ESI |
 |
|---|
| ChTry ESI |
 |
|---|
| ArgC ESI |
 |
|---|
| LysN ESI |
 |
|---|
| TryLysC ESI |
 |
|---|
| Try MALDI |
 |
|---|
| ChTry MALDI |
 |
|---|
| ArgC MALDI |
 |
|---|
| LysN MALDI |
 |
|---|
| TryLysC MALDI |
 |
|---|
| Try LTQ |
 |
|---|
| ChTry LTQ |
 |
|---|
| ArgC LTQ |
 |
|---|
| LysN LTQ |
 |
|---|
| TryLysC LTQ |
 |
|---|
| Try MSlow |
 |
|---|
| ChTry MSlow |
 |
|---|
| ArgC MSlow |
 |
|---|
| LysN MSlow |
 |
|---|
| TryLysC MSlow |
 |
|---|
| Try MShigh |
 |
|---|
| ChTry MShigh |
 |
|---|
| ArgC MShigh |
 |
|---|
| LysN MShigh |
 |
|---|
| TryLysC MShigh |
 |
|---|
General Statistics
Number of major isoforms |
Number of additional isoforms |
Number of all proteins |
Number of amino acids |
Min. Seq. Length |
Max. Seq. Length |
Avg. Seq. Length |
Avg. Mol. Weight |
|---|---|---|---|---|---|---|---|
0 |
640807 |
30 |
1484 |
277.3 |
31.28 |
Amino acid frequency
Ala |
Cys |
Asp |
Glu |
Phe |
Gly |
His |
Ile |
Lys |
Leu |
|---|---|---|---|---|---|---|---|---|---|
6.872 ± 0.057 | 1.345 ± 0.024 |
5.827 ± 0.045 | 6.885 ± 0.056 |
4.534 ± 0.038 | 6.001 ± 0.056 |
1.515 ± 0.019 | 8.164 ± 0.049 |
8.974 ± 0.053 | 8.887 ± 0.051 |
Met |
Asn |
Gln |
Pro |
Arg |
Ser |
Thr |
Val |
Trp |
Tyr |
|---|---|---|---|---|---|---|---|---|---|
2.5 ± 0.027 | 6.328 ± 0.061 |
3.277 ± 0.028 | 3.237 ± 0.028 |
3.488 ± 0.029 | 5.942 ± 0.036 |
5.343 ± 0.038 | 6.018 ± 0.048 |
0.724 ± 0.017 | 4.134 ± 0.044 |
Most of the basic statistics you can see at this page can be downloaded from this CSV file
Proteome-pI is available under Creative Commons Attribution-NoDerivs license, for more details see here
| Reference: Kozlowski LP. Proteome-pI 2.0: Proteome Isoelectric Point Database Update. Nucleic Acids Res. 2021, doi: 10.1093/nar/gkab944 | Contact: Lukasz P. Kozlowski |
