Luteimonas sp. FCS-9
Taxonomy: cellular organisms; Bacteria; Proteobacteria; Gammaproteobacteria; Xanthomonadales; Xanthomonadaceae; Luteimonas; unclassified Luteimonas
Average proteome isoelectric point is 6.61
Get precalculated fractions of proteins

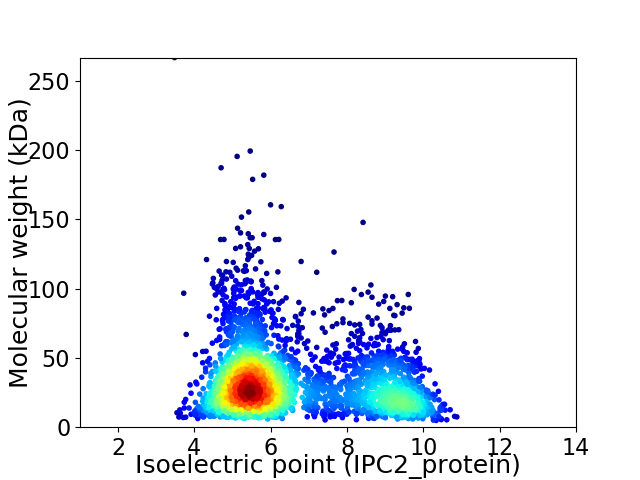
Virtual 2D-PAGE plot for 3200 proteins (isoelectric point calculated using IPC2_protein)
Get csv file with sequences according to given criteria:
* You can choose from 21 different methods for calculating isoelectric point
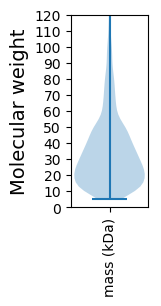
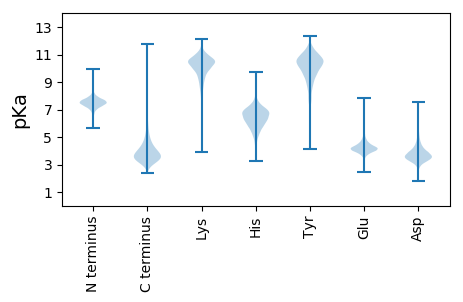
Summary statistics related to proteome-wise predictions


Protein with the lowest isoelectric point:
>tr|A0A0H1ASJ2|A0A0H1ASJ2_9GAMM DUF3298 domain-containing protein OS=Luteimonas sp. FCS-9 OX=1547516 GN=WQ56_04070 PE=4 SV=1
MM1 pKa = 7.5HH2 pKa = 7.32IAAPDD7 pKa = 3.64ALRR10 pKa = 11.84AAFLPPPHH18 pKa = 7.35DD19 pKa = 4.08PQPAAKK25 pKa = 10.08ADD27 pKa = 3.99TPEE30 pKa = 3.61QTPFVRR36 pKa = 11.84GEE38 pKa = 4.18GDD40 pKa = 3.02RR41 pKa = 11.84HH42 pKa = 5.04TVDD45 pKa = 4.65PNDD48 pKa = 3.66IQQDD52 pKa = 4.35GYY54 pKa = 11.19GSCAVLSTLHH64 pKa = 6.76TIAQHH69 pKa = 6.35DD70 pKa = 4.03PSVIQDD76 pKa = 3.99MIQDD80 pKa = 4.22NGDD83 pKa = 2.95GTYY86 pKa = 10.17TVTFQEE92 pKa = 4.39KK93 pKa = 10.25VEE95 pKa = 3.98ILGFTFFKK103 pKa = 10.34PVEE106 pKa = 4.3VTVSGPFTGGAANPADD122 pKa = 3.37VGANGEE128 pKa = 4.47EE129 pKa = 4.15VWPAIIEE136 pKa = 3.88AAYY139 pKa = 8.84AQQYY143 pKa = 10.14KK144 pKa = 10.82GGDD147 pKa = 3.38LTYY150 pKa = 9.32EE151 pKa = 4.21TGVMPADD158 pKa = 3.35VMEE161 pKa = 5.74RR162 pKa = 11.84ILGADD167 pKa = 3.3AQTAGTGEE175 pKa = 4.12VSAEE179 pKa = 3.87QMSQRR184 pKa = 11.84LADD187 pKa = 3.98GEE189 pKa = 4.41ATVAWTPGFKK199 pKa = 10.49DD200 pKa = 5.25DD201 pKa = 5.22DD202 pKa = 4.93GNWLPEE208 pKa = 3.81ITEE211 pKa = 4.06EE212 pKa = 3.93QQALIEE218 pKa = 4.55HH219 pKa = 6.18YY220 pKa = 10.58GIAGGHH226 pKa = 6.75AYY228 pKa = 9.82AVSEE232 pKa = 4.4VIPAGTSYY240 pKa = 11.47VDD242 pKa = 3.35PTTGEE247 pKa = 4.22SVVASEE253 pKa = 5.49DD254 pKa = 4.14VIVLDD259 pKa = 4.49NPWGSSDD266 pKa = 3.76VVMPYY271 pKa = 10.55SDD273 pKa = 3.65YY274 pKa = 11.07QEE276 pKa = 4.17VYY278 pKa = 10.1GWVSSAATEE287 pKa = 3.96
MM1 pKa = 7.5HH2 pKa = 7.32IAAPDD7 pKa = 3.64ALRR10 pKa = 11.84AAFLPPPHH18 pKa = 7.35DD19 pKa = 4.08PQPAAKK25 pKa = 10.08ADD27 pKa = 3.99TPEE30 pKa = 3.61QTPFVRR36 pKa = 11.84GEE38 pKa = 4.18GDD40 pKa = 3.02RR41 pKa = 11.84HH42 pKa = 5.04TVDD45 pKa = 4.65PNDD48 pKa = 3.66IQQDD52 pKa = 4.35GYY54 pKa = 11.19GSCAVLSTLHH64 pKa = 6.76TIAQHH69 pKa = 6.35DD70 pKa = 4.03PSVIQDD76 pKa = 3.99MIQDD80 pKa = 4.22NGDD83 pKa = 2.95GTYY86 pKa = 10.17TVTFQEE92 pKa = 4.39KK93 pKa = 10.25VEE95 pKa = 3.98ILGFTFFKK103 pKa = 10.34PVEE106 pKa = 4.3VTVSGPFTGGAANPADD122 pKa = 3.37VGANGEE128 pKa = 4.47EE129 pKa = 4.15VWPAIIEE136 pKa = 3.88AAYY139 pKa = 8.84AQQYY143 pKa = 10.14KK144 pKa = 10.82GGDD147 pKa = 3.38LTYY150 pKa = 9.32EE151 pKa = 4.21TGVMPADD158 pKa = 3.35VMEE161 pKa = 5.74RR162 pKa = 11.84ILGADD167 pKa = 3.3AQTAGTGEE175 pKa = 4.12VSAEE179 pKa = 3.87QMSQRR184 pKa = 11.84LADD187 pKa = 3.98GEE189 pKa = 4.41ATVAWTPGFKK199 pKa = 10.49DD200 pKa = 5.25DD201 pKa = 5.22DD202 pKa = 4.93GNWLPEE208 pKa = 3.81ITEE211 pKa = 4.06EE212 pKa = 3.93QQALIEE218 pKa = 4.55HH219 pKa = 6.18YY220 pKa = 10.58GIAGGHH226 pKa = 6.75AYY228 pKa = 9.82AVSEE232 pKa = 4.4VIPAGTSYY240 pKa = 11.47VDD242 pKa = 3.35PTTGEE247 pKa = 4.22SVVASEE253 pKa = 5.49DD254 pKa = 4.14VIVLDD259 pKa = 4.49NPWGSSDD266 pKa = 3.76VVMPYY271 pKa = 10.55SDD273 pKa = 3.65YY274 pKa = 11.07QEE276 pKa = 4.17VYY278 pKa = 10.1GWVSSAATEE287 pKa = 3.96
Molecular weight: 30.52 kDa
Isoelectric point according different methods:
Protein with the highest isoelectric point:
>tr|A0A0H1ANH3|A0A0H1ANH3_9GAMM Uncharacterized protein OS=Luteimonas sp. FCS-9 OX=1547516 GN=WQ56_08935 PE=4 SV=1
MM1 pKa = 7.86PLPSATRR8 pKa = 11.84APARR12 pKa = 11.84CRR14 pKa = 11.84RR15 pKa = 11.84PARR18 pKa = 11.84PPRR21 pKa = 11.84PRR23 pKa = 11.84PRR25 pKa = 11.84PRR27 pKa = 11.84PGPPGCRR34 pKa = 11.84TSRR37 pKa = 11.84PRR39 pKa = 11.84AWPRR43 pKa = 11.84PARR46 pKa = 11.84RR47 pKa = 11.84TPRR50 pKa = 11.84AASPAGRR57 pKa = 11.84PGGNGRR63 pKa = 11.84AVRR66 pKa = 11.84LRR68 pKa = 11.84TDD70 pKa = 3.08AAA72 pKa = 3.9
MM1 pKa = 7.86PLPSATRR8 pKa = 11.84APARR12 pKa = 11.84CRR14 pKa = 11.84RR15 pKa = 11.84PARR18 pKa = 11.84PPRR21 pKa = 11.84PRR23 pKa = 11.84PRR25 pKa = 11.84PRR27 pKa = 11.84PGPPGCRR34 pKa = 11.84TSRR37 pKa = 11.84PRR39 pKa = 11.84AWPRR43 pKa = 11.84PARR46 pKa = 11.84RR47 pKa = 11.84TPRR50 pKa = 11.84AASPAGRR57 pKa = 11.84PGGNGRR63 pKa = 11.84AVRR66 pKa = 11.84LRR68 pKa = 11.84TDD70 pKa = 3.08AAA72 pKa = 3.9
Molecular weight: 7.83 kDa
Isoelectric point according different methods:
Peptides (in silico digests for buttom-up proteomics)
Below you can find in silico digests of the whole proteome with Trypsin, Chymotrypsin, Trypsin+LysC, LysN, ArgC proteases suitable for different mass spec machines.| Try ESI |
 |
|---|
| ChTry ESI |
 |
|---|
| ArgC ESI |
 |
|---|
| LysN ESI |
 |
|---|
| TryLysC ESI |
 |
|---|
| Try MALDI |
 |
|---|
| ChTry MALDI |
 |
|---|
| ArgC MALDI |
 |
|---|
| LysN MALDI |
 |
|---|
| TryLysC MALDI |
 |
|---|
| Try LTQ |
 |
|---|
| ChTry LTQ |
 |
|---|
| ArgC LTQ |
 |
|---|
| LysN LTQ |
 |
|---|
| TryLysC LTQ |
 |
|---|
| Try MSlow |
 |
|---|
| ChTry MSlow |
 |
|---|
| ArgC MSlow |
 |
|---|
| LysN MSlow |
 |
|---|
| TryLysC MSlow |
 |
|---|
| Try MShigh |
 |
|---|
| ChTry MShigh |
 |
|---|
| ArgC MShigh |
 |
|---|
| LysN MShigh |
 |
|---|
| TryLysC MShigh |
 |
|---|
General Statistics
Number of major isoforms |
Number of additional isoforms |
Number of all proteins |
Number of amino acids |
Min. Seq. Length |
Max. Seq. Length |
Avg. Seq. Length |
Avg. Mol. Weight |
|---|---|---|---|---|---|---|---|
0 |
1065100 |
41 |
2810 |
332.8 |
35.92 |
Amino acid frequency
Ala |
Cys |
Asp |
Glu |
Phe |
Gly |
His |
Ile |
Lys |
Leu |
|---|---|---|---|---|---|---|---|---|---|
14.355 ± 0.08 | 0.766 ± 0.011 |
6.438 ± 0.038 | 4.982 ± 0.04 |
3.286 ± 0.029 | 8.984 ± 0.038 |
2.222 ± 0.022 | 3.843 ± 0.028 |
1.933 ± 0.033 | 10.709 ± 0.056 |
Met |
Asn |
Gln |
Pro |
Arg |
Ser |
Thr |
Val |
Trp |
Tyr |
|---|---|---|---|---|---|---|---|---|---|
1.989 ± 0.019 | 2.089 ± 0.03 |
5.625 ± 0.041 | 3.395 ± 0.027 |
8.453 ± 0.045 | 4.549 ± 0.032 |
4.93 ± 0.025 | 7.707 ± 0.037 |
1.562 ± 0.021 | 2.184 ± 0.024 |
Most of the basic statistics you can see at this page can be downloaded from this CSV file
Proteome-pI is available under Creative Commons Attribution-NoDerivs license, for more details see here
| Reference: Kozlowski LP. Proteome-pI 2.0: Proteome Isoelectric Point Database Update. Nucleic Acids Res. 2021, doi: 10.1093/nar/gkab944 | Contact: Lukasz P. Kozlowski |
