Pochonia chlamydosporia 170
Taxonomy: cellular organisms; Eukaryota; Opisthokonta; Fungi; Dikarya; Ascomycota; saccharomyceta; Pezizomycotina; leotiomyceta; sordariomyceta; Sordariomycetes; Hypocreomycetidae; Hypocreales; Clavicipitaceae; Pochonia; Pochonia chlamydosporia
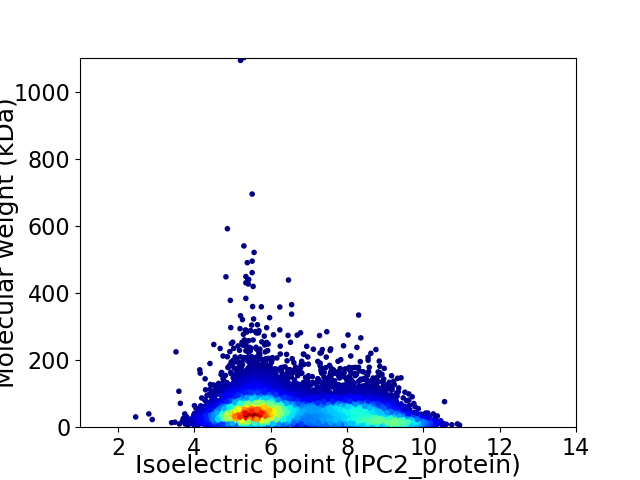
Average proteome isoelectric point is 6.7
Get precalculated fractions of proteins

Virtual 2D-PAGE plot for 14143 proteins (isoelectric point calculated using IPC2_protein)
Get csv file with sequences according to given criteria:
* You can choose from 21 different methods for calculating isoelectric point
Summary statistics related to proteome-wise predictions


Protein with the lowest isoelectric point:
>tr|A0A179FX06|A0A179FX06_METCM Sin3 binding protein OS=Pochonia chlamydosporia 170 OX=1380566 GN=VFPPC_13311 PE=4 SV=1
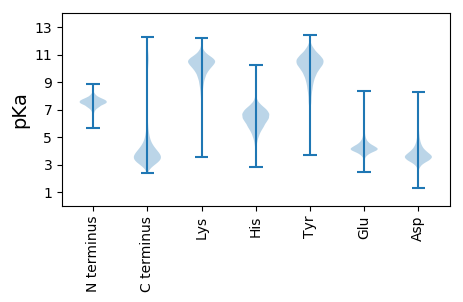
MM1 pKa = 7.24HH2 pKa = 7.89RR3 pKa = 11.84ATISAAVATLLAGNVLARR21 pKa = 11.84DD22 pKa = 3.68VPSNVKK28 pKa = 10.15ALYY31 pKa = 10.36DD32 pKa = 3.94SIRR35 pKa = 11.84SSGSCSNVLQGGFFSQEE52 pKa = 3.69DD53 pKa = 3.78DD54 pKa = 4.11SKK56 pKa = 11.67DD57 pKa = 3.17FCYY60 pKa = 10.75CGDD63 pKa = 3.76HH64 pKa = 6.55LQDD67 pKa = 3.67KK68 pKa = 10.55GIIYY72 pKa = 9.64LQGNGGQLVNMDD84 pKa = 4.35IDD86 pKa = 4.43CDD88 pKa = 3.62GHH90 pKa = 8.32LGQGNGDD97 pKa = 4.06CDD99 pKa = 4.56SSGDD103 pKa = 3.85TQGQTTFGDD112 pKa = 4.07TVASYY117 pKa = 11.52DD118 pKa = 4.96KK119 pKa = 11.51GIDD122 pKa = 3.48DD123 pKa = 4.54LNAYY127 pKa = 7.09VHH129 pKa = 6.54SYY131 pKa = 10.43VVLGNQGSGDD141 pKa = 3.85GYY143 pKa = 11.22VEE145 pKa = 4.63YY146 pKa = 10.41DD147 pKa = 3.48PQGDD151 pKa = 3.88GVEE154 pKa = 4.2PLSVVAVVCGDD165 pKa = 3.01KK166 pKa = 10.35MFYY169 pKa = 10.56GVWGDD174 pKa = 3.62TNGDD178 pKa = 3.78DD179 pKa = 4.39GPPLVGEE186 pKa = 4.42VSLSLGQACYY196 pKa = 10.68GRR198 pKa = 11.84AVNGNEE204 pKa = 3.66AHH206 pKa = 7.61DD207 pKa = 5.13DD208 pKa = 3.72NDD210 pKa = 3.28VLYY213 pKa = 10.38IAFKK217 pKa = 10.7GSNAVPGADD226 pKa = 3.38GADD229 pKa = 3.15WGASSFDD236 pKa = 3.69DD237 pKa = 4.57FEE239 pKa = 6.15NSLASLGDD247 pKa = 3.74SLVSQLL253 pKa = 4.58
MM1 pKa = 7.24HH2 pKa = 7.89RR3 pKa = 11.84ATISAAVATLLAGNVLARR21 pKa = 11.84DD22 pKa = 3.68VPSNVKK28 pKa = 10.15ALYY31 pKa = 10.36DD32 pKa = 3.94SIRR35 pKa = 11.84SSGSCSNVLQGGFFSQEE52 pKa = 3.69DD53 pKa = 3.78DD54 pKa = 4.11SKK56 pKa = 11.67DD57 pKa = 3.17FCYY60 pKa = 10.75CGDD63 pKa = 3.76HH64 pKa = 6.55LQDD67 pKa = 3.67KK68 pKa = 10.55GIIYY72 pKa = 9.64LQGNGGQLVNMDD84 pKa = 4.35IDD86 pKa = 4.43CDD88 pKa = 3.62GHH90 pKa = 8.32LGQGNGDD97 pKa = 4.06CDD99 pKa = 4.56SSGDD103 pKa = 3.85TQGQTTFGDD112 pKa = 4.07TVASYY117 pKa = 11.52DD118 pKa = 4.96KK119 pKa = 11.51GIDD122 pKa = 3.48DD123 pKa = 4.54LNAYY127 pKa = 7.09VHH129 pKa = 6.54SYY131 pKa = 10.43VVLGNQGSGDD141 pKa = 3.85GYY143 pKa = 11.22VEE145 pKa = 4.63YY146 pKa = 10.41DD147 pKa = 3.48PQGDD151 pKa = 3.88GVEE154 pKa = 4.2PLSVVAVVCGDD165 pKa = 3.01KK166 pKa = 10.35MFYY169 pKa = 10.56GVWGDD174 pKa = 3.62TNGDD178 pKa = 3.78DD179 pKa = 4.39GPPLVGEE186 pKa = 4.42VSLSLGQACYY196 pKa = 10.68GRR198 pKa = 11.84AVNGNEE204 pKa = 3.66AHH206 pKa = 7.61DD207 pKa = 5.13DD208 pKa = 3.72NDD210 pKa = 3.28VLYY213 pKa = 10.38IAFKK217 pKa = 10.7GSNAVPGADD226 pKa = 3.38GADD229 pKa = 3.15WGASSFDD236 pKa = 3.69DD237 pKa = 4.57FEE239 pKa = 6.15NSLASLGDD247 pKa = 3.74SLVSQLL253 pKa = 4.58
Molecular weight: 26.33 kDa
Isoelectric point according different methods:
Protein with the highest isoelectric point:
>tr|A0A219ARW6|A0A219ARW6_METCM Uncharacterized protein OS=Pochonia chlamydosporia 170 OX=1380566 GN=VFPPC_17354 PE=4 SV=1
MM1 pKa = 7.51HH2 pKa = 7.43SLNFSLIIHH11 pKa = 5.72VQGTWILLKK20 pKa = 10.54RR21 pKa = 11.84QVATTGRR28 pKa = 11.84RR29 pKa = 11.84HH30 pKa = 5.88HH31 pKa = 6.29HH32 pKa = 6.12HH33 pKa = 6.26QLNSSNRR40 pKa = 11.84SRR42 pKa = 11.84KK43 pKa = 6.85TQALLTPRR51 pKa = 11.84TT52 pKa = 3.82
MM1 pKa = 7.51HH2 pKa = 7.43SLNFSLIIHH11 pKa = 5.72VQGTWILLKK20 pKa = 10.54RR21 pKa = 11.84QVATTGRR28 pKa = 11.84RR29 pKa = 11.84HH30 pKa = 5.88HH31 pKa = 6.29HH32 pKa = 6.12HH33 pKa = 6.26QLNSSNRR40 pKa = 11.84SRR42 pKa = 11.84KK43 pKa = 6.85TQALLTPRR51 pKa = 11.84TT52 pKa = 3.82
Molecular weight: 6.08 kDa
Isoelectric point according different methods:
Peptides (in silico digests for buttom-up proteomics)
Below you can find in silico digests of the whole proteome with Trypsin, Chymotrypsin, Trypsin+LysC, LysN, ArgC proteases suitable for different mass spec machines.| Try ESI |
 |
|---|
| ChTry ESI |
 |
|---|
| ArgC ESI |
 |
|---|
| LysN ESI |
 |
|---|
| TryLysC ESI |
 |
|---|
| Try MALDI |
 |
|---|
| ChTry MALDI |
 |
|---|
| ArgC MALDI |
 |
|---|
| LysN MALDI |
 |
|---|
| TryLysC MALDI |
 |
|---|
| Try LTQ |
 |
|---|
| ChTry LTQ |
 |
|---|
| ArgC LTQ |
 |
|---|
| LysN LTQ |
 |
|---|
| TryLysC LTQ |
 |
|---|
| Try MSlow |
 |
|---|
| ChTry MSlow |
 |
|---|
| ArgC MSlow |
 |
|---|
| LysN MSlow |
 |
|---|
| TryLysC MSlow |
 |
|---|
| Try MShigh |
 |
|---|
| ChTry MShigh |
 |
|---|
| ArgC MShigh |
 |
|---|
| LysN MShigh |
 |
|---|
| TryLysC MShigh |
 |
|---|
General Statistics
Number of major isoforms |
Number of additional isoforms |
Number of all proteins |
Number of amino acids |
Min. Seq. Length |
Max. Seq. Length |
Avg. Seq. Length |
Avg. Mol. Weight |
|---|---|---|---|---|---|---|---|
0 |
6505054 |
38 |
9980 |
459.9 |
50.96 |
Amino acid frequency
Ala |
Cys |
Asp |
Glu |
Phe |
Gly |
His |
Ile |
Lys |
Leu |
|---|---|---|---|---|---|---|---|---|---|
8.52 ± 0.02 | 1.395 ± 0.009 |
5.762 ± 0.016 | 5.847 ± 0.02 |
3.738 ± 0.013 | 6.931 ± 0.023 |
2.452 ± 0.009 | 4.968 ± 0.015 |
4.936 ± 0.019 | 8.921 ± 0.025 |
Met |
Asn |
Gln |
Pro |
Arg |
Ser |
Thr |
Val |
Trp |
Tyr |
|---|---|---|---|---|---|---|---|---|---|
2.275 ± 0.008 | 3.791 ± 0.01 |
5.734 ± 0.022 | 4.083 ± 0.015 |
6.067 ± 0.022 | 8.086 ± 0.019 |
5.966 ± 0.015 | 6.208 ± 0.017 |
1.567 ± 0.007 | 2.752 ± 0.01 |
Most of the basic statistics you can see at this page can be downloaded from this CSV file
Proteome-pI is available under Creative Commons Attribution-NoDerivs license, for more details see here
| Reference: Kozlowski LP. Proteome-pI 2.0: Proteome Isoelectric Point Database Update. Nucleic Acids Res. 2021, doi: 10.1093/nar/gkab944 | Contact: Lukasz P. Kozlowski |
