Actinocorallia herbida
Taxonomy: cellular organisms; Bacteria; Terrabacteria group; Actinobacteria; Actinomycetia; Streptosporangiales; Thermomonosporaceae; Actinocorallia
Average proteome isoelectric point is 6.27
Get precalculated fractions of proteins

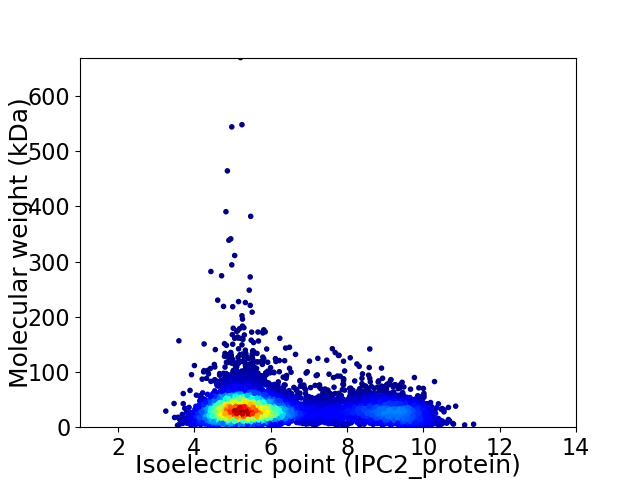
Virtual 2D-PAGE plot for 8804 proteins (isoelectric point calculated using IPC2_protein)
Get csv file with sequences according to given criteria:
* You can choose from 21 different methods for calculating isoelectric point
Summary statistics related to proteome-wise predictions


Protein with the lowest isoelectric point:
>tr|A0A3N1CUK6|A0A3N1CUK6_9ACTN Uncharacterized protein (TIGR03086 family) OS=Actinocorallia herbida OX=58109 GN=EDD29_1911 PE=4 SV=1
MM1 pKa = 7.76SEE3 pKa = 3.88VTEE6 pKa = 4.76PYY8 pKa = 9.67ATGTPCWVDD17 pKa = 5.27LMAKK21 pKa = 9.66DD22 pKa = 3.44QQAALDD28 pKa = 4.32FYY30 pKa = 11.44RR31 pKa = 11.84EE32 pKa = 3.89LLGWQGEE39 pKa = 4.15IGPAEE44 pKa = 3.91FGGYY48 pKa = 7.0TVCEE52 pKa = 4.03LNGRR56 pKa = 11.84AVAGIAPTMAPEE68 pKa = 4.73GASEE72 pKa = 4.62PPTVWTNYY80 pKa = 9.97LSSTDD85 pKa = 3.47AQATQDD91 pKa = 4.1AIVAAGGLLIAPVMDD106 pKa = 3.62VGSLGRR112 pKa = 11.84MLVAADD118 pKa = 3.47PQGAVFGVWEE128 pKa = 4.23ARR130 pKa = 11.84DD131 pKa = 3.4FAGAQVVNEE140 pKa = 4.15AGALVWNEE148 pKa = 3.96LHH150 pKa = 6.67TDD152 pKa = 4.84DD153 pKa = 5.53IPGATAFYY161 pKa = 11.25AEE163 pKa = 4.67AFDD166 pKa = 5.55LRR168 pKa = 11.84IKK170 pKa = 10.4PMEE173 pKa = 4.3GAEE176 pKa = 4.52PYY178 pKa = 10.52CEE180 pKa = 4.56LRR182 pKa = 11.84VGDD185 pKa = 3.86QCVGGATHH193 pKa = 7.61LAADD197 pKa = 3.94PPGTPSHH204 pKa = 6.55WLTYY208 pKa = 9.87FAVDD212 pKa = 4.62DD213 pKa = 3.99VDD215 pKa = 5.01ASVDD219 pKa = 3.4TLLEE223 pKa = 4.23HH224 pKa = 6.91GGTVLAPPFDD234 pKa = 4.49MIAGRR239 pKa = 11.84MTVVTDD245 pKa = 3.61PQGAPFALINPTPMM259 pKa = 4.56
MM1 pKa = 7.76SEE3 pKa = 3.88VTEE6 pKa = 4.76PYY8 pKa = 9.67ATGTPCWVDD17 pKa = 5.27LMAKK21 pKa = 9.66DD22 pKa = 3.44QQAALDD28 pKa = 4.32FYY30 pKa = 11.44RR31 pKa = 11.84EE32 pKa = 3.89LLGWQGEE39 pKa = 4.15IGPAEE44 pKa = 3.91FGGYY48 pKa = 7.0TVCEE52 pKa = 4.03LNGRR56 pKa = 11.84AVAGIAPTMAPEE68 pKa = 4.73GASEE72 pKa = 4.62PPTVWTNYY80 pKa = 9.97LSSTDD85 pKa = 3.47AQATQDD91 pKa = 4.1AIVAAGGLLIAPVMDD106 pKa = 3.62VGSLGRR112 pKa = 11.84MLVAADD118 pKa = 3.47PQGAVFGVWEE128 pKa = 4.23ARR130 pKa = 11.84DD131 pKa = 3.4FAGAQVVNEE140 pKa = 4.15AGALVWNEE148 pKa = 3.96LHH150 pKa = 6.67TDD152 pKa = 4.84DD153 pKa = 5.53IPGATAFYY161 pKa = 11.25AEE163 pKa = 4.67AFDD166 pKa = 5.55LRR168 pKa = 11.84IKK170 pKa = 10.4PMEE173 pKa = 4.3GAEE176 pKa = 4.52PYY178 pKa = 10.52CEE180 pKa = 4.56LRR182 pKa = 11.84VGDD185 pKa = 3.86QCVGGATHH193 pKa = 7.61LAADD197 pKa = 3.94PPGTPSHH204 pKa = 6.55WLTYY208 pKa = 9.87FAVDD212 pKa = 4.62DD213 pKa = 3.99VDD215 pKa = 5.01ASVDD219 pKa = 3.4TLLEE223 pKa = 4.23HH224 pKa = 6.91GGTVLAPPFDD234 pKa = 4.49MIAGRR239 pKa = 11.84MTVVTDD245 pKa = 3.61PQGAPFALINPTPMM259 pKa = 4.56
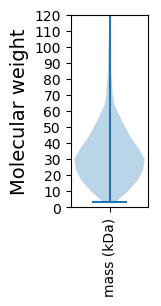
Molecular weight: 27.23 kDa
Isoelectric point according different methods:
Protein with the highest isoelectric point:
>tr|A0A3N1DB48|A0A3N1DB48_9ACTN Aryl-alcohol dehydrogenase-like predicted oxidoreductase OS=Actinocorallia herbida OX=58109 GN=EDD29_8491 PE=4 SV=1
MM1 pKa = 7.69SKK3 pKa = 9.0RR4 pKa = 11.84TFQPNNRR11 pKa = 11.84RR12 pKa = 11.84RR13 pKa = 11.84HH14 pKa = 5.34KK15 pKa = 10.47KK16 pKa = 8.84HH17 pKa = 5.5GFRR20 pKa = 11.84LRR22 pKa = 11.84MRR24 pKa = 11.84TRR26 pKa = 11.84AGQAILAARR35 pKa = 11.84RR36 pKa = 11.84RR37 pKa = 11.84KK38 pKa = 9.43GRR40 pKa = 11.84ARR42 pKa = 11.84VAVV45 pKa = 3.65
MM1 pKa = 7.69SKK3 pKa = 9.0RR4 pKa = 11.84TFQPNNRR11 pKa = 11.84RR12 pKa = 11.84RR13 pKa = 11.84HH14 pKa = 5.34KK15 pKa = 10.47KK16 pKa = 8.84HH17 pKa = 5.5GFRR20 pKa = 11.84LRR22 pKa = 11.84MRR24 pKa = 11.84TRR26 pKa = 11.84AGQAILAARR35 pKa = 11.84RR36 pKa = 11.84RR37 pKa = 11.84KK38 pKa = 9.43GRR40 pKa = 11.84ARR42 pKa = 11.84VAVV45 pKa = 3.65
Molecular weight: 5.4 kDa
Isoelectric point according different methods:
Peptides (in silico digests for buttom-up proteomics)
Below you can find in silico digests of the whole proteome with Trypsin, Chymotrypsin, Trypsin+LysC, LysN, ArgC proteases suitable for different mass spec machines.| Try ESI |
 |
|---|
| ChTry ESI |
 |
|---|
| ArgC ESI |
 |
|---|
| LysN ESI |
 |
|---|
| TryLysC ESI |
 |
|---|
| Try MALDI |
 |
|---|
| ChTry MALDI |
 |
|---|
| ArgC MALDI |
 |
|---|
| LysN MALDI |
 |
|---|
| TryLysC MALDI |
 |
|---|
| Try LTQ |
 |
|---|
| ChTry LTQ |
 |
|---|
| ArgC LTQ |
 |
|---|
| LysN LTQ |
 |
|---|
| TryLysC LTQ |
 |
|---|
| Try MSlow |
 |
|---|
| ChTry MSlow |
 |
|---|
| ArgC MSlow |
 |
|---|
| LysN MSlow |
 |
|---|
| TryLysC MSlow |
 |
|---|
| Try MShigh |
 |
|---|
| ChTry MShigh |
 |
|---|
| ArgC MShigh |
 |
|---|
| LysN MShigh |
 |
|---|
| TryLysC MShigh |
 |
|---|
General Statistics
Number of major isoforms |
Number of additional isoforms |
Number of all proteins |
Number of amino acids |
Min. Seq. Length |
Max. Seq. Length |
Avg. Seq. Length |
Avg. Mol. Weight |
|---|---|---|---|---|---|---|---|
0 |
2882551 |
29 |
6424 |
327.4 |
34.99 |
Amino acid frequency
Ala |
Cys |
Asp |
Glu |
Phe |
Gly |
His |
Ile |
Lys |
Leu |
|---|---|---|---|---|---|---|---|---|---|
13.997 ± 0.038 | 0.767 ± 0.007 |
5.932 ± 0.021 | 5.746 ± 0.023 |
2.97 ± 0.014 | 9.506 ± 0.023 |
2.2 ± 0.013 | 3.443 ± 0.02 |
2.068 ± 0.02 | 10.743 ± 0.036 |
Met |
Asn |
Gln |
Pro |
Arg |
Ser |
Thr |
Val |
Trp |
Tyr |
|---|---|---|---|---|---|---|---|---|---|
1.723 ± 0.012 | 1.64 ± 0.014 |
6.213 ± 0.027 | 2.379 ± 0.014 |
7.961 ± 0.028 | 4.85 ± 0.019 |
5.861 ± 0.021 | 8.472 ± 0.025 |
1.518 ± 0.011 | 2.009 ± 0.013 |
Most of the basic statistics you can see at this page can be downloaded from this CSV file
Proteome-pI is available under Creative Commons Attribution-NoDerivs license, for more details see here
| Reference: Kozlowski LP. Proteome-pI 2.0: Proteome Isoelectric Point Database Update. Nucleic Acids Res. 2021, doi: 10.1093/nar/gkab944 | Contact: Lukasz P. Kozlowski |
