Bacteroides sp. CAG:189
Taxonomy: cellular organisms; Bacteria; FCB group; Bacteroidetes/Chlorobi group; Bacteroidetes; Bacteroidia; Bacteroidales; Bacteroidaceae; Bacteroides; environmental samples
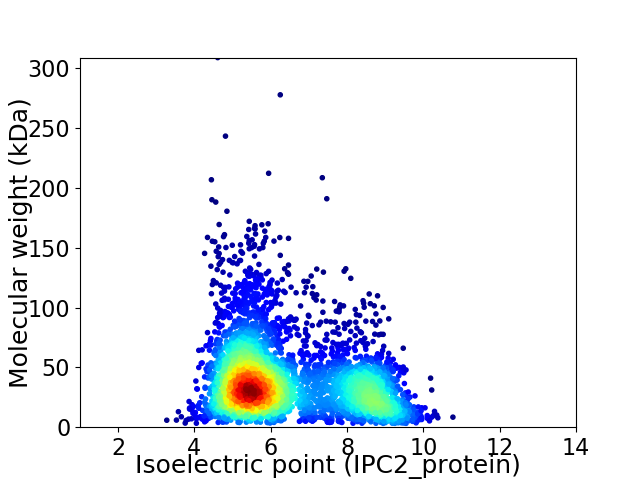
Average proteome isoelectric point is 6.39
Get precalculated fractions of proteins

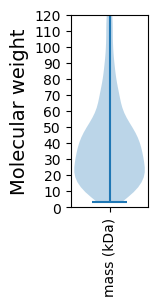
Virtual 2D-PAGE plot for 3866 proteins (isoelectric point calculated using IPC2_protein)
Get csv file with sequences according to given criteria:
* You can choose from 21 different methods for calculating isoelectric point
Summary statistics related to proteome-wise predictions


Protein with the lowest isoelectric point:
>tr|R5J862|R5J862_9BACE Sensor protein rprX OS=Bacteroides sp. CAG:189 OX=1262737 GN=BN523_02526 PE=4 SV=1
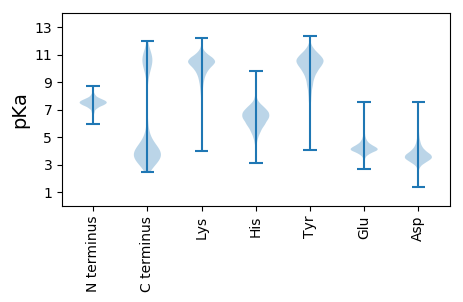
MM1 pKa = 7.38KK2 pKa = 10.29FKK4 pKa = 10.77YY5 pKa = 10.46YY6 pKa = 10.63LGAVMLAIILFSFSACDD23 pKa = 3.52NDD25 pKa = 5.08DD26 pKa = 5.43DD27 pKa = 5.35YY28 pKa = 11.61MPPNQDD34 pKa = 3.15IITALKK40 pKa = 9.82QLYY43 pKa = 9.74PDD45 pKa = 3.57VQDD48 pKa = 4.64IEE50 pKa = 4.4WSQKK54 pKa = 8.49GVYY57 pKa = 9.22YY58 pKa = 10.89VADD61 pKa = 3.48CWVNGSEE68 pKa = 4.57LDD70 pKa = 3.39VWFDD74 pKa = 4.67ANANWIMTEE83 pKa = 3.72MEE85 pKa = 4.33IFRR88 pKa = 11.84EE89 pKa = 3.87QLPAAVNTAYY99 pKa = 10.18EE100 pKa = 3.96EE101 pKa = 4.02SGYY104 pKa = 10.91GDD106 pKa = 3.41WVIDD110 pKa = 3.81NLTKK114 pKa = 10.21LTFPHH119 pKa = 6.82KK120 pKa = 10.34SEE122 pKa = 3.96EE123 pKa = 4.28FVFEE127 pKa = 4.24VQRR130 pKa = 11.84GAQEE134 pKa = 3.59RR135 pKa = 11.84ALYY138 pKa = 9.36YY139 pKa = 10.12SAYY142 pKa = 10.44GGLLLEE148 pKa = 5.25KK149 pKa = 10.18DD150 pKa = 3.2ITDD153 pKa = 4.32ADD155 pKa = 3.88DD156 pKa = 3.7THH158 pKa = 6.82WPDD161 pKa = 3.57VEE163 pKa = 4.12
MM1 pKa = 7.38KK2 pKa = 10.29FKK4 pKa = 10.77YY5 pKa = 10.46YY6 pKa = 10.63LGAVMLAIILFSFSACDD23 pKa = 3.52NDD25 pKa = 5.08DD26 pKa = 5.43DD27 pKa = 5.35YY28 pKa = 11.61MPPNQDD34 pKa = 3.15IITALKK40 pKa = 9.82QLYY43 pKa = 9.74PDD45 pKa = 3.57VQDD48 pKa = 4.64IEE50 pKa = 4.4WSQKK54 pKa = 8.49GVYY57 pKa = 9.22YY58 pKa = 10.89VADD61 pKa = 3.48CWVNGSEE68 pKa = 4.57LDD70 pKa = 3.39VWFDD74 pKa = 4.67ANANWIMTEE83 pKa = 3.72MEE85 pKa = 4.33IFRR88 pKa = 11.84EE89 pKa = 3.87QLPAAVNTAYY99 pKa = 10.18EE100 pKa = 3.96EE101 pKa = 4.02SGYY104 pKa = 10.91GDD106 pKa = 3.41WVIDD110 pKa = 3.81NLTKK114 pKa = 10.21LTFPHH119 pKa = 6.82KK120 pKa = 10.34SEE122 pKa = 3.96EE123 pKa = 4.28FVFEE127 pKa = 4.24VQRR130 pKa = 11.84GAQEE134 pKa = 3.59RR135 pKa = 11.84ALYY138 pKa = 9.36YY139 pKa = 10.12SAYY142 pKa = 10.44GGLLLEE148 pKa = 5.25KK149 pKa = 10.18DD150 pKa = 3.2ITDD153 pKa = 4.32ADD155 pKa = 3.88DD156 pKa = 3.7THH158 pKa = 6.82WPDD161 pKa = 3.57VEE163 pKa = 4.12
Molecular weight: 18.87 kDa
Isoelectric point according different methods:
Protein with the highest isoelectric point:
>tr|R5JLV2|R5JLV2_9BACE WYL domain-containing protein OS=Bacteroides sp. CAG:189 OX=1262737 GN=BN523_02166 PE=4 SV=1
MM1 pKa = 7.41GGISPFTRR9 pKa = 11.84FKK11 pKa = 10.96VVYY14 pKa = 9.98SSPSLLKK21 pKa = 10.79EE22 pKa = 3.81MASGQRR28 pKa = 11.84NSEE31 pKa = 3.76GLYY34 pKa = 8.99TVAYY38 pKa = 7.97MPSLNRR44 pKa = 11.84CPQILALLFTKK55 pKa = 10.51PSARR59 pKa = 11.84NTGSAQLWPPSSLTDD74 pKa = 3.22VKK76 pKa = 11.41ACFHH80 pKa = 5.87RR81 pKa = 11.84QARR84 pKa = 11.84RR85 pKa = 11.84PSGSVV90 pKa = 2.71
MM1 pKa = 7.41GGISPFTRR9 pKa = 11.84FKK11 pKa = 10.96VVYY14 pKa = 9.98SSPSLLKK21 pKa = 10.79EE22 pKa = 3.81MASGQRR28 pKa = 11.84NSEE31 pKa = 3.76GLYY34 pKa = 8.99TVAYY38 pKa = 7.97MPSLNRR44 pKa = 11.84CPQILALLFTKK55 pKa = 10.51PSARR59 pKa = 11.84NTGSAQLWPPSSLTDD74 pKa = 3.22VKK76 pKa = 11.41ACFHH80 pKa = 5.87RR81 pKa = 11.84QARR84 pKa = 11.84RR85 pKa = 11.84PSGSVV90 pKa = 2.71
Molecular weight: 9.85 kDa
Isoelectric point according different methods:
Peptides (in silico digests for buttom-up proteomics)
Below you can find in silico digests of the whole proteome with Trypsin, Chymotrypsin, Trypsin+LysC, LysN, ArgC proteases suitable for different mass spec machines.| Try ESI |
 |
|---|
| ChTry ESI |
 |
|---|
| ArgC ESI |
 |
|---|
| LysN ESI |
 |
|---|
| TryLysC ESI |
 |
|---|
| Try MALDI |
 |
|---|
| ChTry MALDI |
 |
|---|
| ArgC MALDI |
 |
|---|
| LysN MALDI |
 |
|---|
| TryLysC MALDI |
 |
|---|
| Try LTQ |
 |
|---|
| ChTry LTQ |
 |
|---|
| ArgC LTQ |
 |
|---|
| LysN LTQ |
 |
|---|
| TryLysC LTQ |
 |
|---|
| Try MSlow |
 |
|---|
| ChTry MSlow |
 |
|---|
| ArgC MSlow |
 |
|---|
| LysN MSlow |
 |
|---|
| TryLysC MSlow |
 |
|---|
| Try MShigh |
 |
|---|
| ChTry MShigh |
 |
|---|
| ArgC MShigh |
 |
|---|
| LysN MShigh |
 |
|---|
| TryLysC MShigh |
 |
|---|
General Statistics
Number of major isoforms |
Number of additional isoforms |
Number of all proteins |
Number of amino acids |
Min. Seq. Length |
Max. Seq. Length |
Avg. Seq. Length |
Avg. Mol. Weight |
|---|---|---|---|---|---|---|---|
0 |
1447579 |
29 |
2818 |
374.4 |
42.24 |
Amino acid frequency
Ala |
Cys |
Asp |
Glu |
Phe |
Gly |
His |
Ile |
Lys |
Leu |
|---|---|---|---|---|---|---|---|---|---|
6.897 ± 0.035 | 1.228 ± 0.014 |
5.54 ± 0.027 | 6.537 ± 0.034 |
4.593 ± 0.022 | 6.941 ± 0.035 |
1.816 ± 0.017 | 7.08 ± 0.036 |
6.555 ± 0.034 | 8.971 ± 0.037 |
Met |
Asn |
Gln |
Pro |
Arg |
Ser |
Thr |
Val |
Trp |
Tyr |
|---|---|---|---|---|---|---|---|---|---|
2.701 ± 0.018 | 5.252 ± 0.03 |
3.742 ± 0.02 | 3.337 ± 0.02 |
4.48 ± 0.031 | 6.194 ± 0.031 |
5.773 ± 0.028 | 6.474 ± 0.034 |
1.297 ± 0.016 | 4.591 ± 0.029 |
Most of the basic statistics you can see at this page can be downloaded from this CSV file
Proteome-pI is available under Creative Commons Attribution-NoDerivs license, for more details see here
| Reference: Kozlowski LP. Proteome-pI 2.0: Proteome Isoelectric Point Database Update. Nucleic Acids Res. 2021, doi: 10.1093/nar/gkab944 | Contact: Lukasz P. Kozlowski |
