Nocardioides sp. zg-579
Taxonomy: cellular organisms; Bacteria; Terrabacteria group; Actinobacteria; Actinomycetia; Propionibacteriales; Nocardioidaceae; Nocardioides; unclassified Nocardioides
Average proteome isoelectric point is 5.99
Get precalculated fractions of proteins

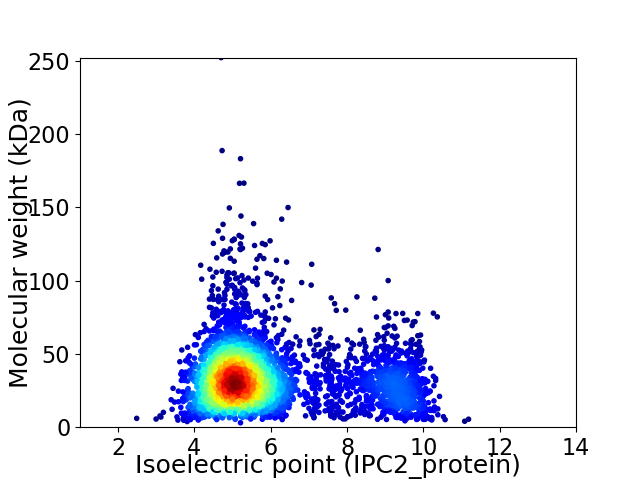
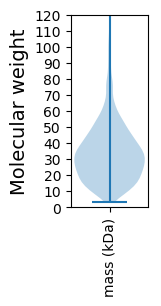
Virtual 2D-PAGE plot for 4040 proteins (isoelectric point calculated using IPC2_protein)
Get csv file with sequences according to given criteria:
* You can choose from 21 different methods for calculating isoelectric point
Summary statistics related to proteome-wise predictions


Protein with the lowest isoelectric point:
>tr|A0A6I3JA02|A0A6I3JA02_9ACTN SDR family NAD(P)-dependent oxidoreductase OS=Nocardioides sp. zg-579 OX=2663857 GN=GGQ22_06345 PE=3 SV=1
MM1 pKa = 7.78LKK3 pKa = 10.36RR4 pKa = 11.84PLAALATLAAVSLLASCGDD23 pKa = 4.26DD24 pKa = 3.72EE25 pKa = 5.31SSPDD29 pKa = 4.03AGDD32 pKa = 3.7SPAASASSGSEE43 pKa = 3.53KK44 pKa = 9.97ATPSAEE50 pKa = 4.15GASGPTCVYY59 pKa = 10.0PQDD62 pKa = 4.01GQPAAKK68 pKa = 10.09DD69 pKa = 3.5VEE71 pKa = 4.71LPPNPAAVKK80 pKa = 8.7GTIEE84 pKa = 4.16GSMATTIGDD93 pKa = 3.27IGISLDD99 pKa = 3.87AKK101 pKa = 10.82ASPCTVNSFVSLAEE115 pKa = 3.54QGYY118 pKa = 10.28FDD120 pKa = 5.23DD121 pKa = 4.65TTCHH125 pKa = 7.07RR126 pKa = 11.84LTTADD131 pKa = 3.04TGIEE135 pKa = 4.01VLQCGDD141 pKa = 3.44PTGTGTGGPGYY152 pKa = 9.07TIEE155 pKa = 5.9DD156 pKa = 4.14EE157 pKa = 4.47VTPDD161 pKa = 3.02TTYY164 pKa = 10.69PAGTLAMAKK173 pKa = 9.07TPAPDD178 pKa = 3.13SGGSQFFIVYY188 pKa = 10.01GDD190 pKa = 3.65TPLPPEE196 pKa = 3.92YY197 pKa = 9.91TVFGSIDD204 pKa = 3.57EE205 pKa = 4.99AGLKK209 pKa = 9.81AVQEE213 pKa = 4.2AAAEE217 pKa = 4.36GTTDD221 pKa = 4.4GGPDD225 pKa = 3.89GQPKK229 pKa = 9.47VAVDD233 pKa = 3.75IEE235 pKa = 4.75SVTIDD240 pKa = 3.68DD241 pKa = 4.0
MM1 pKa = 7.78LKK3 pKa = 10.36RR4 pKa = 11.84PLAALATLAAVSLLASCGDD23 pKa = 4.26DD24 pKa = 3.72EE25 pKa = 5.31SSPDD29 pKa = 4.03AGDD32 pKa = 3.7SPAASASSGSEE43 pKa = 3.53KK44 pKa = 9.97ATPSAEE50 pKa = 4.15GASGPTCVYY59 pKa = 10.0PQDD62 pKa = 4.01GQPAAKK68 pKa = 10.09DD69 pKa = 3.5VEE71 pKa = 4.71LPPNPAAVKK80 pKa = 8.7GTIEE84 pKa = 4.16GSMATTIGDD93 pKa = 3.27IGISLDD99 pKa = 3.87AKK101 pKa = 10.82ASPCTVNSFVSLAEE115 pKa = 3.54QGYY118 pKa = 10.28FDD120 pKa = 5.23DD121 pKa = 4.65TTCHH125 pKa = 7.07RR126 pKa = 11.84LTTADD131 pKa = 3.04TGIEE135 pKa = 4.01VLQCGDD141 pKa = 3.44PTGTGTGGPGYY152 pKa = 9.07TIEE155 pKa = 5.9DD156 pKa = 4.14EE157 pKa = 4.47VTPDD161 pKa = 3.02TTYY164 pKa = 10.69PAGTLAMAKK173 pKa = 9.07TPAPDD178 pKa = 3.13SGGSQFFIVYY188 pKa = 10.01GDD190 pKa = 3.65TPLPPEE196 pKa = 3.92YY197 pKa = 9.91TVFGSIDD204 pKa = 3.57EE205 pKa = 4.99AGLKK209 pKa = 9.81AVQEE213 pKa = 4.2AAAEE217 pKa = 4.36GTTDD221 pKa = 4.4GGPDD225 pKa = 3.89GQPKK229 pKa = 9.47VAVDD233 pKa = 3.75IEE235 pKa = 4.75SVTIDD240 pKa = 3.68DD241 pKa = 4.0
Molecular weight: 24.06 kDa
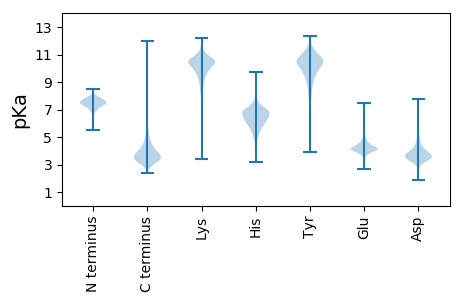
Isoelectric point according different methods:
Protein with the highest isoelectric point:
>tr|A0A6I3J0J2|A0A6I3J0J2_9ACTN Uncharacterized protein OS=Nocardioides sp. zg-579 OX=2663857 GN=GGQ22_07900 PE=4 SV=1
MM1 pKa = 7.4GSVIKK6 pKa = 10.42KK7 pKa = 8.47RR8 pKa = 11.84RR9 pKa = 11.84KK10 pKa = 9.22RR11 pKa = 11.84MAKK14 pKa = 9.41KK15 pKa = 9.99KK16 pKa = 9.77HH17 pKa = 5.81RR18 pKa = 11.84KK19 pKa = 8.51LLKK22 pKa = 8.15KK23 pKa = 9.24TRR25 pKa = 11.84VQRR28 pKa = 11.84RR29 pKa = 11.84KK30 pKa = 10.07LGKK33 pKa = 9.87
MM1 pKa = 7.4GSVIKK6 pKa = 10.42KK7 pKa = 8.47RR8 pKa = 11.84RR9 pKa = 11.84KK10 pKa = 9.22RR11 pKa = 11.84MAKK14 pKa = 9.41KK15 pKa = 9.99KK16 pKa = 9.77HH17 pKa = 5.81RR18 pKa = 11.84KK19 pKa = 8.51LLKK22 pKa = 8.15KK23 pKa = 9.24TRR25 pKa = 11.84VQRR28 pKa = 11.84RR29 pKa = 11.84KK30 pKa = 10.07LGKK33 pKa = 9.87
Molecular weight: 4.07 kDa
Isoelectric point according different methods:
Peptides (in silico digests for buttom-up proteomics)
Below you can find in silico digests of the whole proteome with Trypsin, Chymotrypsin, Trypsin+LysC, LysN, ArgC proteases suitable for different mass spec machines.| Try ESI |
 |
|---|
| ChTry ESI |
 |
|---|
| ArgC ESI |
 |
|---|
| LysN ESI |
 |
|---|
| TryLysC ESI |
 |
|---|
| Try MALDI |
 |
|---|
| ChTry MALDI |
 |
|---|
| ArgC MALDI |
 |
|---|
| LysN MALDI |
 |
|---|
| TryLysC MALDI |
 |
|---|
| Try LTQ |
 |
|---|
| ChTry LTQ |
 |
|---|
| ArgC LTQ |
 |
|---|
| LysN LTQ |
 |
|---|
| TryLysC LTQ |
 |
|---|
| Try MSlow |
 |
|---|
| ChTry MSlow |
 |
|---|
| ArgC MSlow |
 |
|---|
| LysN MSlow |
 |
|---|
| TryLysC MSlow |
 |
|---|
| Try MShigh |
 |
|---|
| ChTry MShigh |
 |
|---|
| ArgC MShigh |
 |
|---|
| LysN MShigh |
 |
|---|
| TryLysC MShigh |
 |
|---|
General Statistics
Number of major isoforms |
Number of additional isoforms |
Number of all proteins |
Number of amino acids |
Min. Seq. Length |
Max. Seq. Length |
Avg. Seq. Length |
Avg. Mol. Weight |
|---|---|---|---|---|---|---|---|
0 |
1327210 |
29 |
2470 |
328.5 |
35.06 |
Amino acid frequency
Ala |
Cys |
Asp |
Glu |
Phe |
Gly |
His |
Ile |
Lys |
Leu |
|---|---|---|---|---|---|---|---|---|---|
13.693 ± 0.065 | 0.724 ± 0.01 |
6.341 ± 0.035 | 5.989 ± 0.04 |
2.607 ± 0.019 | 9.44 ± 0.035 |
2.188 ± 0.02 | 3.002 ± 0.025 |
1.754 ± 0.031 | 10.388 ± 0.048 |
Met |
Asn |
Gln |
Pro |
Arg |
Ser |
Thr |
Val |
Trp |
Tyr |
|---|---|---|---|---|---|---|---|---|---|
1.731 ± 0.016 | 1.546 ± 0.019 |
5.906 ± 0.03 | 2.605 ± 0.02 |
8.028 ± 0.04 | 4.89 ± 0.023 |
6.001 ± 0.032 | 9.79 ± 0.037 |
1.52 ± 0.017 | 1.856 ± 0.02 |
Most of the basic statistics you can see at this page can be downloaded from this CSV file
Proteome-pI is available under Creative Commons Attribution-NoDerivs license, for more details see here
| Reference: Kozlowski LP. Proteome-pI 2.0: Proteome Isoelectric Point Database Update. Nucleic Acids Res. 2021, doi: 10.1093/nar/gkab944 | Contact: Lukasz P. Kozlowski |
