Klebsiella phage Matisse
Taxonomy: Viruses; Duplodnaviria; Heunggongvirae; Uroviricota; Caudoviricetes; Caudovirales; Myoviridae; Tevenvirinae; Slopekvirus; Klebsiella virus Matisse
Average proteome isoelectric point is 6.23
Get precalculated fractions of proteins

Virtual 2D-PAGE plot for 280 proteins (isoelectric point calculated using IPC2_protein)
Get csv file with sequences according to given criteria:
* You can choose from 21 different methods for calculating isoelectric point
Summary statistics related to proteome-wise predictions


Protein with the lowest isoelectric point:
>tr|A0A0K1LQC2|A0A0K1LQC2_9CAUD Head assembly protein OS=Klebsiella phage Matisse OX=1675607 GN=CPT_Matisse36 PE=4 SV=1
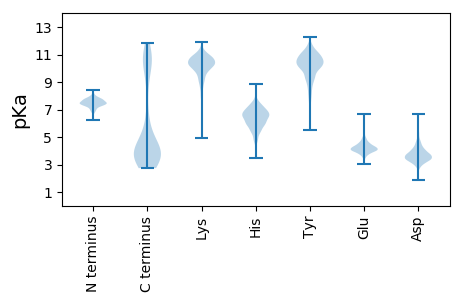
MM1 pKa = 7.7INLDD5 pKa = 3.44FCKK8 pKa = 10.88AEE10 pKa = 4.03MQADD14 pKa = 3.72ADD16 pKa = 3.98EE17 pKa = 4.99EE18 pKa = 4.45EE19 pKa = 4.65PKK21 pKa = 10.41FDD23 pKa = 4.2SPHH26 pKa = 5.84SSRR29 pKa = 11.84WIVAVDD35 pKa = 3.36DD36 pKa = 4.18EE37 pKa = 5.63GYY39 pKa = 8.7VTVLSRR45 pKa = 11.84PFIHH49 pKa = 7.68DD50 pKa = 3.38AFFEE54 pKa = 4.47CGRR57 pKa = 11.84SAEE60 pKa = 4.86DD61 pKa = 2.84IGLPDD66 pKa = 4.08SVEE69 pKa = 4.18MPPGVYY75 pKa = 9.52EE76 pKa = 4.23WICGFEE82 pKa = 4.0QTTDD86 pKa = 2.87WEE88 pKa = 4.3TGYY91 pKa = 11.05VDD93 pKa = 3.11GWEE96 pKa = 4.47FYY98 pKa = 10.33PNEE101 pKa = 4.04STLLYY106 pKa = 9.89SWEE109 pKa = 3.95NGKK112 pKa = 10.18VNEE115 pKa = 4.75SGNQEE120 pKa = 4.11TQSDD124 pKa = 4.0NGSGSLL130 pKa = 4.04
MM1 pKa = 7.7INLDD5 pKa = 3.44FCKK8 pKa = 10.88AEE10 pKa = 4.03MQADD14 pKa = 3.72ADD16 pKa = 3.98EE17 pKa = 4.99EE18 pKa = 4.45EE19 pKa = 4.65PKK21 pKa = 10.41FDD23 pKa = 4.2SPHH26 pKa = 5.84SSRR29 pKa = 11.84WIVAVDD35 pKa = 3.36DD36 pKa = 4.18EE37 pKa = 5.63GYY39 pKa = 8.7VTVLSRR45 pKa = 11.84PFIHH49 pKa = 7.68DD50 pKa = 3.38AFFEE54 pKa = 4.47CGRR57 pKa = 11.84SAEE60 pKa = 4.86DD61 pKa = 2.84IGLPDD66 pKa = 4.08SVEE69 pKa = 4.18MPPGVYY75 pKa = 9.52EE76 pKa = 4.23WICGFEE82 pKa = 4.0QTTDD86 pKa = 2.87WEE88 pKa = 4.3TGYY91 pKa = 11.05VDD93 pKa = 3.11GWEE96 pKa = 4.47FYY98 pKa = 10.33PNEE101 pKa = 4.04STLLYY106 pKa = 9.89SWEE109 pKa = 3.95NGKK112 pKa = 10.18VNEE115 pKa = 4.75SGNQEE120 pKa = 4.11TQSDD124 pKa = 4.0NGSGSLL130 pKa = 4.04
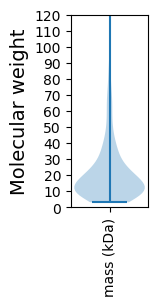
Molecular weight: 14.69 kDa
Isoelectric point according different methods:
Protein with the highest isoelectric point:
>tr|A0A0K1LPL7|A0A0K1LPL7_9CAUD Uncharacterized protein OS=Klebsiella phage Matisse OX=1675607 GN=CPT_Matisse158 PE=4 SV=1
MM1 pKa = 7.16KK2 pKa = 10.17RR3 pKa = 11.84SYY5 pKa = 11.65NMNEE9 pKa = 3.59LVFFKK14 pKa = 10.23TRR16 pKa = 11.84RR17 pKa = 11.84EE18 pKa = 3.6ARR20 pKa = 11.84AYY22 pKa = 10.51VLAAGKK28 pKa = 7.95NTSAAIDD35 pKa = 3.7MGTDD39 pKa = 3.15KK40 pKa = 11.32AVGARR45 pKa = 11.84WAAVIVIAAPVTPVKK60 pKa = 10.13TLVLGARR67 pKa = 11.84HH68 pKa = 6.69AEE70 pKa = 4.22TLNTAASGRR79 pKa = 11.84GHH81 pKa = 5.46EE82 pKa = 4.17VKK84 pKa = 10.57VFKK87 pKa = 10.58KK88 pKa = 10.43RR89 pKa = 11.84SYY91 pKa = 10.47LSCARR96 pKa = 11.84GG97 pKa = 3.1
MM1 pKa = 7.16KK2 pKa = 10.17RR3 pKa = 11.84SYY5 pKa = 11.65NMNEE9 pKa = 3.59LVFFKK14 pKa = 10.23TRR16 pKa = 11.84RR17 pKa = 11.84EE18 pKa = 3.6ARR20 pKa = 11.84AYY22 pKa = 10.51VLAAGKK28 pKa = 7.95NTSAAIDD35 pKa = 3.7MGTDD39 pKa = 3.15KK40 pKa = 11.32AVGARR45 pKa = 11.84WAAVIVIAAPVTPVKK60 pKa = 10.13TLVLGARR67 pKa = 11.84HH68 pKa = 6.69AEE70 pKa = 4.22TLNTAASGRR79 pKa = 11.84GHH81 pKa = 5.46EE82 pKa = 4.17VKK84 pKa = 10.57VFKK87 pKa = 10.58KK88 pKa = 10.43RR89 pKa = 11.84SYY91 pKa = 10.47LSCARR96 pKa = 11.84GG97 pKa = 3.1
Molecular weight: 10.5 kDa
Isoelectric point according different methods:
Peptides (in silico digests for buttom-up proteomics)
Below you can find in silico digests of the whole proteome with Trypsin, Chymotrypsin, Trypsin+LysC, LysN, ArgC proteases suitable for different mass spec machines.| Try ESI |
 |
|---|
| ChTry ESI |
 |
|---|
| ArgC ESI |
 |
|---|
| LysN ESI |
 |
|---|
| TryLysC ESI |
 |
|---|
| Try MALDI |
 |
|---|
| ChTry MALDI |
 |
|---|
| ArgC MALDI |
 |
|---|
| LysN MALDI |
 |
|---|
| TryLysC MALDI |
 |
|---|
| Try LTQ |
 |
|---|
| ChTry LTQ |
 |
|---|
| ArgC LTQ |
 |
|---|
| LysN LTQ |
 |
|---|
| TryLysC LTQ |
 |
|---|
| Try MSlow |
 |
|---|
| ChTry MSlow |
 |
|---|
| ArgC MSlow |
 |
|---|
| LysN MSlow |
 |
|---|
| TryLysC MSlow |
 |
|---|
| Try MShigh |
 |
|---|
| ChTry MShigh |
 |
|---|
| ArgC MShigh |
 |
|---|
| LysN MShigh |
 |
|---|
| TryLysC MShigh |
 |
|---|
General Statistics
Number of major isoforms |
Number of additional isoforms |
Number of all proteins |
Number of amino acids |
Min. Seq. Length |
Max. Seq. Length |
Avg. Seq. Length |
Avg. Mol. Weight |
|---|---|---|---|---|---|---|---|
0 |
55911 |
26 |
1349 |
199.7 |
22.66 |
Amino acid frequency
Ala |
Cys |
Asp |
Glu |
Phe |
Gly |
His |
Ile |
Lys |
Leu |
|---|---|---|---|---|---|---|---|---|---|
6.691 ± 0.154 | 1.225 ± 0.064 |
6.611 ± 0.103 | 6.915 ± 0.176 |
4.121 ± 0.089 | 6.283 ± 0.169 |
1.771 ± 0.08 | 6.736 ± 0.119 |
7.405 ± 0.195 | 7.453 ± 0.157 |
Met |
Asn |
Gln |
Pro |
Arg |
Ser |
Thr |
Val |
Trp |
Tyr |
|---|---|---|---|---|---|---|---|---|---|
2.974 ± 0.079 | 5.48 ± 0.122 |
3.538 ± 0.069 | 3.255 ± 0.094 |
4.745 ± 0.11 | 6.051 ± 0.133 |
5.933 ± 0.189 | 6.966 ± 0.137 |
1.332 ± 0.045 | 4.516 ± 0.115 |
Most of the basic statistics you can see at this page can be downloaded from this CSV file
Proteome-pI is available under Creative Commons Attribution-NoDerivs license, for more details see here
| Reference: Kozlowski LP. Proteome-pI 2.0: Proteome Isoelectric Point Database Update. Nucleic Acids Res. 2021, doi: 10.1093/nar/gkab944 | Contact: Lukasz P. Kozlowski |
