Escherichia phage Mt1B1_P10
Taxonomy: Viruses; Duplodnaviria; Heunggongvirae; Uroviricota; Caudoviricetes; Caudovirales; Autographiviridae; Molineuxvirinae; Vectrevirus; unclassified Vectrevirus
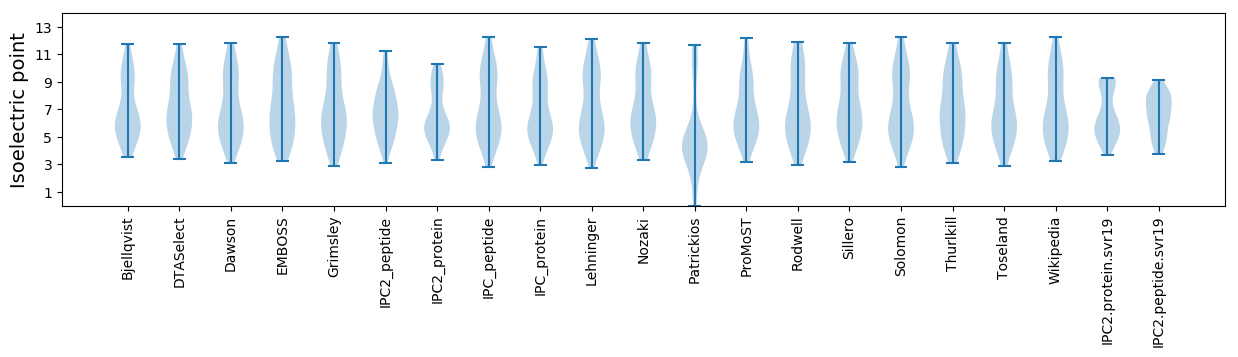
Average proteome isoelectric point is 6.64
Get precalculated fractions of proteins

Virtual 2D-PAGE plot for 54 proteins (isoelectric point calculated using IPC2_protein)
Get csv file with sequences according to given criteria:
* You can choose from 21 different methods for calculating isoelectric point
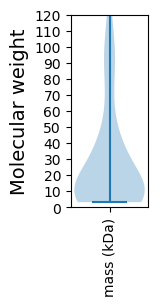
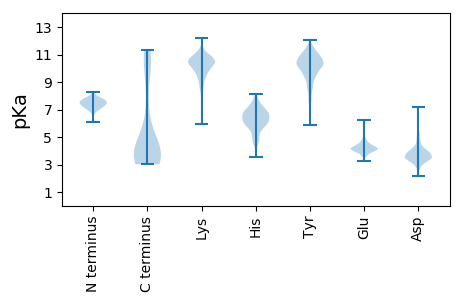
Summary statistics related to proteome-wise predictions
Protein with the lowest isoelectric point:
>tr|A0A7H0XCA2|A0A7H0XCA2_9CAUD Uncharacterized protein OS=Escherichia phage Mt1B1_P10 OX=2743960 PE=4 SV=1
MM1 pKa = 7.37EE2 pKa = 5.49RR3 pKa = 11.84NANAYY8 pKa = 10.02YY9 pKa = 10.68NLLAATVEE17 pKa = 4.22AFNEE21 pKa = 4.26RR22 pKa = 11.84IKK24 pKa = 10.94YY25 pKa = 10.29DD26 pKa = 4.13EE27 pKa = 4.11IRR29 pKa = 11.84EE30 pKa = 4.15DD31 pKa = 4.41DD32 pKa = 4.57DD33 pKa = 5.3YY34 pKa = 12.04SDD36 pKa = 4.39ALHH39 pKa = 6.34EE40 pKa = 4.6VVDD43 pKa = 3.79SHH45 pKa = 7.75VPVYY49 pKa = 10.35YY50 pKa = 10.66SEE52 pKa = 4.53IFTVMAADD60 pKa = 5.26GIDD63 pKa = 3.82VEE65 pKa = 5.34FEE67 pKa = 4.13DD68 pKa = 5.51AGLIPDD74 pKa = 4.15TKK76 pKa = 10.54DD77 pKa = 2.9VTMILQARR85 pKa = 11.84IYY87 pKa = 8.84EE88 pKa = 4.09ALYY91 pKa = 10.89NDD93 pKa = 4.1VPNDD97 pKa = 3.65SDD99 pKa = 4.27VVWYY103 pKa = 10.1EE104 pKa = 3.97DD105 pKa = 3.82EE106 pKa = 4.55EE107 pKa = 4.43EE108 pKa = 4.19EE109 pKa = 5.07KK110 pKa = 11.16
MM1 pKa = 7.37EE2 pKa = 5.49RR3 pKa = 11.84NANAYY8 pKa = 10.02YY9 pKa = 10.68NLLAATVEE17 pKa = 4.22AFNEE21 pKa = 4.26RR22 pKa = 11.84IKK24 pKa = 10.94YY25 pKa = 10.29DD26 pKa = 4.13EE27 pKa = 4.11IRR29 pKa = 11.84EE30 pKa = 4.15DD31 pKa = 4.41DD32 pKa = 4.57DD33 pKa = 5.3YY34 pKa = 12.04SDD36 pKa = 4.39ALHH39 pKa = 6.34EE40 pKa = 4.6VVDD43 pKa = 3.79SHH45 pKa = 7.75VPVYY49 pKa = 10.35YY50 pKa = 10.66SEE52 pKa = 4.53IFTVMAADD60 pKa = 5.26GIDD63 pKa = 3.82VEE65 pKa = 5.34FEE67 pKa = 4.13DD68 pKa = 5.51AGLIPDD74 pKa = 4.15TKK76 pKa = 10.54DD77 pKa = 2.9VTMILQARR85 pKa = 11.84IYY87 pKa = 8.84EE88 pKa = 4.09ALYY91 pKa = 10.89NDD93 pKa = 4.1VPNDD97 pKa = 3.65SDD99 pKa = 4.27VVWYY103 pKa = 10.1EE104 pKa = 3.97DD105 pKa = 3.82EE106 pKa = 4.55EE107 pKa = 4.43EE108 pKa = 4.19EE109 pKa = 5.07KK110 pKa = 11.16
Molecular weight: 12.77 kDa
Isoelectric point according different methods:
Protein with the highest isoelectric point:
>tr|A0A7H0XC98|A0A7H0XC98_9CAUD DNA-directed RNA polymerase OS=Escherichia phage Mt1B1_P10 OX=2743960 PE=3 SV=1
MM1 pKa = 7.19RR2 pKa = 11.84HH3 pKa = 5.3VYY5 pKa = 9.79VNGMLHH11 pKa = 5.92VVGKK15 pKa = 10.52RR16 pKa = 11.84KK17 pKa = 9.37GHH19 pKa = 4.96SRR21 pKa = 11.84RR22 pKa = 11.84NGLLILCEE30 pKa = 4.39AIVRR34 pKa = 11.84YY35 pKa = 9.5
MM1 pKa = 7.19RR2 pKa = 11.84HH3 pKa = 5.3VYY5 pKa = 9.79VNGMLHH11 pKa = 5.92VVGKK15 pKa = 10.52RR16 pKa = 11.84KK17 pKa = 9.37GHH19 pKa = 4.96SRR21 pKa = 11.84RR22 pKa = 11.84NGLLILCEE30 pKa = 4.39AIVRR34 pKa = 11.84YY35 pKa = 9.5
Molecular weight: 4.08 kDa
Isoelectric point according different methods:
Peptides (in silico digests for buttom-up proteomics)
Below you can find in silico digests of the whole proteome with Trypsin, Chymotrypsin, Trypsin+LysC, LysN, ArgC proteases suitable for different mass spec machines.| Try ESI |
 |
|---|
| ChTry ESI |
|
|---|
| ArgC ESI |
|
|---|
| LysN ESI |
|
|---|
| TryLysC ESI |
|
|---|
| Try MALDI |
|
|---|
| ChTry MALDI |
|
|---|
| ArgC MALDI |
|
|---|
| LysN MALDI |
|
|---|
| TryLysC MALDI |
|
|---|
| Try LTQ |
|
|---|
| ChTry LTQ |
|
|---|
| ArgC LTQ |
|
|---|
| LysN LTQ |
|
|---|
| TryLysC LTQ |
|
|---|
| Try MSlow |
|
|---|
| ChTry MSlow |
|
|---|
| ArgC MSlow |
|
|---|
| LysN MSlow |
|
|---|
| TryLysC MSlow |
|
|---|
| Try MShigh |
|
|---|
| ChTry MShigh |
|
|---|
| ArgC MShigh |
|
|---|
| LysN MShigh |
|
|---|
| TryLysC MShigh |
|
|---|
General Statistics
Number of major isoforms |
Number of additional isoforms |
Number of all proteins |
Number of amino acids |
Min. Seq. Length |
Max. Seq. Length |
Avg. Seq. Length |
Avg. Mol. Weight |
|---|---|---|---|---|---|---|---|
0 |
13507 |
29 |
1102 |
250.1 |
27.93 |
Amino acid frequency
Ala |
Cys |
Asp |
Glu |
Phe |
Gly |
His |
Ile |
Lys |
Leu |
|---|---|---|---|---|---|---|---|---|---|
9.003 ± 0.445 | 1.096 ± 0.174 |
6.108 ± 0.208 | 6.885 ± 0.37 |
3.665 ± 0.136 | 7.833 ± 0.373 |
2.169 ± 0.239 | 5.271 ± 0.24 |
6.574 ± 0.302 | 7.863 ± 0.239 |
Met |
Asn |
Gln |
Pro |
Arg |
Ser |
Thr |
Val |
Trp |
Tyr |
|---|---|---|---|---|---|---|---|---|---|
3.006 ± 0.168 | 4.331 ± 0.253 |
3.606 ± 0.191 | 4.205 ± 0.245 |
5.434 ± 0.267 | 5.701 ± 0.264 |
5.397 ± 0.219 | 6.782 ± 0.279 |
1.466 ± 0.111 | 3.606 ± 0.222 |
Most of the basic statistics you can see at this page can be downloaded from this CSV file
See this proteome in:

Proteome-pI is available under Creative Commons Attribution-NoDerivs license, for more details see here
| Reference: Kozlowski LP. Proteome-pI 2.0: Proteome Isoelectric Point Database Update. Nucleic Acids Res. 2021, doi: 10.1093/nar/gkab944 | Contact: Lukasz P. Kozlowski |