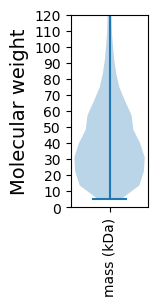
Cadophora sp. DSE1049
Taxonomy: cellular organisms; Eukaryota; Opisthokonta; Fungi; Dikarya; Ascomycota; saccharomyceta; Pezizomycotina; leotiomyceta; sordariomyceta; Leotiomycetes; Helotiales; Helotiales incertae sedis; Cadophora; unclassified Cadophora
Average proteome isoelectric point is 6.54
Get precalculated fractions of proteins

Virtual 2D-PAGE plot for 22755 proteins (isoelectric point calculated using IPC2_protein)
Get csv file with sequences according to given criteria:
* You can choose from 21 different methods for calculating isoelectric point
Summary statistics related to proteome-wise predictions


Protein with the lowest isoelectric point:
>tr|A0A2V1BVC4|A0A2V1BVC4_9HELO Protein kinase domain-containing protein OS=Cadophora sp. DSE1049 OX=1485229 GN=DL98DRAFT_656798 PE=4 SV=1
MM1 pKa = 7.02QLKK4 pKa = 10.04NLLPAALVAGAAAQSLTDD22 pKa = 3.86VLAANNDD29 pKa = 3.99TLSSLTSLISADD41 pKa = 3.7PALLEE46 pKa = 4.26ALGGASNITILAPSNDD62 pKa = 3.18ALAAFLNSTAGAAAATDD79 pKa = 4.1PGAVAALITYY89 pKa = 9.36HH90 pKa = 6.01VLNGTYY96 pKa = 9.42PASAFTNTSQFIPTLLSNSSYY117 pKa = 11.66SNVTGGQVVEE127 pKa = 3.85ARR129 pKa = 11.84LRR131 pKa = 11.84GEE133 pKa = 3.88TASIFTGLLSASNVSVANVNFTGGVVHH160 pKa = 7.04VIDD163 pKa = 4.41SVLTVPQSASNTAGALNLTSLAGALTSADD192 pKa = 3.28LVEE195 pKa = 4.56TVDD198 pKa = 3.83GLSDD202 pKa = 3.41VTIFAPSNEE211 pKa = 3.86AFQAIGSALPNLSTEE226 pKa = 4.28ALSSILTYY234 pKa = 10.5HH235 pKa = 6.04VVQGTVGYY243 pKa = 10.67SSILTNTTLEE253 pKa = 4.44TVNGEE258 pKa = 4.24SVTISIVNGTVYY270 pKa = 10.8VNSAMVTIPDD280 pKa = 3.45ILIAGGVVHH289 pKa = 7.07VIDD292 pKa = 5.5SVLNPNNTSAAPPTAGATTTTPAFTGASSATDD324 pKa = 3.36VPFTSGVSASTTVTSVPTRR343 pKa = 11.84DD344 pKa = 3.61PEE346 pKa = 4.2ATSTSTAGAAPLQTGMIGLGALFGGAALVMGNLL379 pKa = 3.8
MM1 pKa = 7.02QLKK4 pKa = 10.04NLLPAALVAGAAAQSLTDD22 pKa = 3.86VLAANNDD29 pKa = 3.99TLSSLTSLISADD41 pKa = 3.7PALLEE46 pKa = 4.26ALGGASNITILAPSNDD62 pKa = 3.18ALAAFLNSTAGAAAATDD79 pKa = 4.1PGAVAALITYY89 pKa = 9.36HH90 pKa = 6.01VLNGTYY96 pKa = 9.42PASAFTNTSQFIPTLLSNSSYY117 pKa = 11.66SNVTGGQVVEE127 pKa = 3.85ARR129 pKa = 11.84LRR131 pKa = 11.84GEE133 pKa = 3.88TASIFTGLLSASNVSVANVNFTGGVVHH160 pKa = 7.04VIDD163 pKa = 4.41SVLTVPQSASNTAGALNLTSLAGALTSADD192 pKa = 3.28LVEE195 pKa = 4.56TVDD198 pKa = 3.83GLSDD202 pKa = 3.41VTIFAPSNEE211 pKa = 3.86AFQAIGSALPNLSTEE226 pKa = 4.28ALSSILTYY234 pKa = 10.5HH235 pKa = 6.04VVQGTVGYY243 pKa = 10.67SSILTNTTLEE253 pKa = 4.44TVNGEE258 pKa = 4.24SVTISIVNGTVYY270 pKa = 10.8VNSAMVTIPDD280 pKa = 3.45ILIAGGVVHH289 pKa = 7.07VIDD292 pKa = 5.5SVLNPNNTSAAPPTAGATTTTPAFTGASSATDD324 pKa = 3.36VPFTSGVSASTTVTSVPTRR343 pKa = 11.84DD344 pKa = 3.61PEE346 pKa = 4.2ATSTSTAGAAPLQTGMIGLGALFGGAALVMGNLL379 pKa = 3.8
Molecular weight: 37.41 kDa
Isoelectric point according different methods:
Protein with the highest isoelectric point:
>tr|A0A2V1C141|A0A2V1C141_9HELO Uncharacterized protein OS=Cadophora sp. DSE1049 OX=1485229 GN=DL98DRAFT_590024 PE=4 SV=1
MM1 pKa = 7.25QSHH4 pKa = 5.45KK5 pKa = 8.84TFRR8 pKa = 11.84TKK10 pKa = 10.69VKK12 pKa = 10.16LARR15 pKa = 11.84AQKK18 pKa = 9.1QNRR21 pKa = 11.84PIPQWIRR28 pKa = 11.84LRR30 pKa = 11.84TGNTIRR36 pKa = 11.84YY37 pKa = 5.79NAKK40 pKa = 8.89RR41 pKa = 11.84RR42 pKa = 11.84HH43 pKa = 4.15WRR45 pKa = 11.84KK46 pKa = 7.38TRR48 pKa = 11.84IGII51 pKa = 4.0
MM1 pKa = 7.25QSHH4 pKa = 5.45KK5 pKa = 8.84TFRR8 pKa = 11.84TKK10 pKa = 10.69VKK12 pKa = 10.16LARR15 pKa = 11.84AQKK18 pKa = 9.1QNRR21 pKa = 11.84PIPQWIRR28 pKa = 11.84LRR30 pKa = 11.84TGNTIRR36 pKa = 11.84YY37 pKa = 5.79NAKK40 pKa = 8.89RR41 pKa = 11.84RR42 pKa = 11.84HH43 pKa = 4.15WRR45 pKa = 11.84KK46 pKa = 7.38TRR48 pKa = 11.84IGII51 pKa = 4.0
Molecular weight: 6.3 kDa
Isoelectric point according different methods:
Peptides (in silico digests for buttom-up proteomics)
Below you can find in silico digests of the whole proteome with Trypsin, Chymotrypsin, Trypsin+LysC, LysN, ArgC proteases suitable for different mass spec machines.| Try ESI |
 |
|---|
| ChTry ESI |
 |
|---|
| ArgC ESI |
 |
|---|
| LysN ESI |
 |
|---|
| TryLysC ESI |
 |
|---|
| Try MALDI |
 |
|---|
| ChTry MALDI |
 |
|---|
| ArgC MALDI |
 |
|---|
| LysN MALDI |
 |
|---|
| TryLysC MALDI |
 |
|---|
| Try LTQ |
 |
|---|
| ChTry LTQ |
 |
|---|
| ArgC LTQ |
 |
|---|
| LysN LTQ |
 |
|---|
| TryLysC LTQ |
 |
|---|
| Try MSlow |
 |
|---|
| ChTry MSlow |
 |
|---|
| ArgC MSlow |
 |
|---|
| LysN MSlow |
 |
|---|
| TryLysC MSlow |
 |
|---|
| Try MShigh |
 |
|---|
| ChTry MShigh |
 |
|---|
| ArgC MShigh |
 |
|---|
| LysN MShigh |
 |
|---|
| TryLysC MShigh |
 |
|---|
General Statistics
Number of major isoforms |
Number of additional isoforms |
Number of all proteins |
Number of amino acids |
Min. Seq. Length |
Max. Seq. Length |
Avg. Seq. Length |
Avg. Mol. Weight |
|---|---|---|---|---|---|---|---|
0 |
9288616 |
49 |
7844 |
408.2 |
45.26 |
Amino acid frequency
Ala |
Cys |
Asp |
Glu |
Phe |
Gly |
His |
Ile |
Lys |
Leu |
|---|---|---|---|---|---|---|---|---|---|
8.109 ± 0.014 | 1.396 ± 0.007 |
5.461 ± 0.014 | 6.094 ± 0.017 |
3.968 ± 0.01 | 6.976 ± 0.017 |
2.298 ± 0.007 | 5.334 ± 0.01 |
5.033 ± 0.018 | 8.962 ± 0.017 |
Met |
Asn |
Gln |
Pro |
Arg |
Ser |
Thr |
Val |
Trp |
Tyr |
|---|---|---|---|---|---|---|---|---|---|
2.236 ± 0.006 | 3.826 ± 0.01 |
5.743 ± 0.016 | 3.805 ± 0.011 |
5.735 ± 0.014 | 8.324 ± 0.017 |
6.102 ± 0.012 | 6.123 ± 0.011 |
1.588 ± 0.006 | 2.888 ± 0.009 |
Most of the basic statistics you can see at this page can be downloaded from this CSV file
Proteome-pI is available under Creative Commons Attribution-NoDerivs license, for more details see here
| Reference: Kozlowski LP. Proteome-pI 2.0: Proteome Isoelectric Point Database Update. Nucleic Acids Res. 2021, doi: 10.1093/nar/gkab944 | Contact: Lukasz P. Kozlowski |
