Ruminiclostridium herbifermentans
Taxonomy: cellular organisms; Bacteria; Terrabacteria group; Firmicutes; Clostridia; Eubacteriales; Oscillospiraceae; Ruminiclostridium
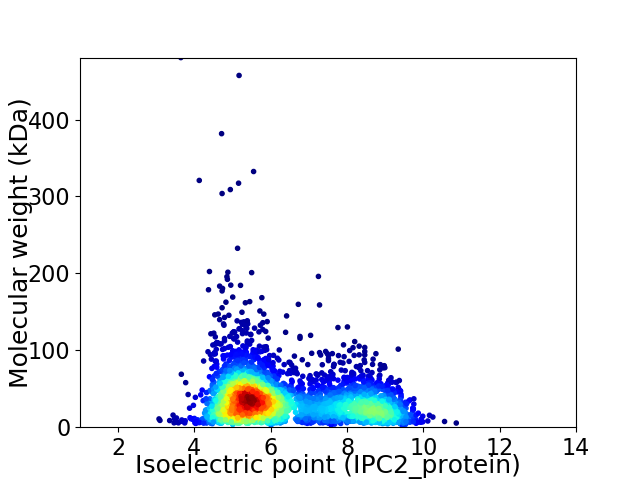
Average proteome isoelectric point is 6.32
Get precalculated fractions of proteins

Virtual 2D-PAGE plot for 3957 proteins (isoelectric point calculated using IPC2_protein)
Get csv file with sequences according to given criteria:
* You can choose from 21 different methods for calculating isoelectric point
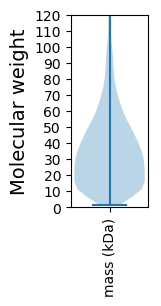
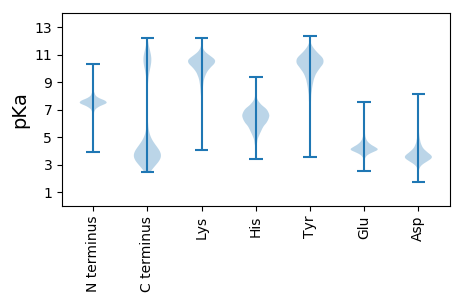
Summary statistics related to proteome-wise predictions


Protein with the lowest isoelectric point:
>tr|A0A4U7JDP9|A0A4U7JDP9_9FIRM Primosomal protein N' OS=Ruminiclostridium herbifermentans OX=2488810 GN=priA PE=3 SV=1
MM1 pKa = 6.93ATEE4 pKa = 5.24LIVNGGFEE12 pKa = 4.44TGSFPPWGAVEE23 pKa = 3.99ATITSLFSHH32 pKa = 6.97TGTYY36 pKa = 9.87SAQLQNGTSVIYY48 pKa = 7.84QTVYY52 pKa = 11.17GDD54 pKa = 3.6FSQPVEE60 pKa = 4.14VSAYY64 pKa = 8.33LAKK67 pKa = 10.71VGASPNPIVSIVLSYY82 pKa = 10.99FDD84 pKa = 4.26NSFNFLGTGLVISIPEE100 pKa = 4.02SNIPDD105 pKa = 3.86VIGGDD110 pKa = 3.16WLKK113 pKa = 11.09AVGTSIPAPVGTDD126 pKa = 3.48FAILSISKK134 pKa = 8.39NTLAGGADD142 pKa = 3.6VLVDD146 pKa = 3.86DD147 pKa = 4.97VSILEE152 pKa = 4.67GPVSPTGPTGPSGPSGPTGPTGPTGPTGPTGPTGPTGPTGPGGGATGPTGPTGPTGPAGATGPTGPAGITGPTGPTGPAGATGPTGPVGPTGPGGGATGPTGPAGATGPTGPTGPAGVTGPTGPVGPTGPGGGATGPTGPAGATGPTGPAGTTGPTGPAGVTGPTGPGGGATGPTGPAGATGPTGPAGATGPTGPAGVTGPTGPIGPTGPGGGATGPTGPAGATGPTGPAGVTGPTGITGTTGPAGATGPTGPAGATGPTGPAGATGPTGPAGTTGPTGPAGVTGPTGADD442 pKa = 3.47GATGPTGPAGSTGPIGPTGPAGSTGPIGPTGPAGSTGPIGPTGPAGSTGPAGSTGPIGPTGPAGSTGPIGPTGPAGSTGPIGPTGPAGSTGPIGPTGPAGSTGPIGPTGPAGSTGPAGVTGATGPAGVTGPTGITGPTGPAGATGPTGPAGATGPTGPAGITGPTGPAGTTGPTGPAGTTGPAGLEE628 pKa = 4.08AFGGLYY634 pKa = 9.25STDD637 pKa = 3.49SQTLSIGIGGGVDD650 pKa = 3.43QIEE653 pKa = 4.51LAEE656 pKa = 4.38TMPSSDD662 pKa = 3.13VTLGTNNITILDD674 pKa = 3.8SGTYY678 pKa = 9.04EE679 pKa = 3.64IEE681 pKa = 4.15YY682 pKa = 8.85MVTVGTVVLAVNLSAGVRR700 pKa = 11.84VNGGTNFIPSTFQTRR715 pKa = 11.84LLSLTLTTLFEE726 pKa = 4.65GSTIVDD732 pKa = 4.36LAAGDD737 pKa = 4.31VIDD740 pKa = 5.71LAVQSTDD747 pKa = 3.16SVSASLTGGLTAYY760 pKa = 8.69LTVKK764 pKa = 10.26KK765 pKa = 10.63ISII768 pKa = 3.97
MM1 pKa = 6.93ATEE4 pKa = 5.24LIVNGGFEE12 pKa = 4.44TGSFPPWGAVEE23 pKa = 3.99ATITSLFSHH32 pKa = 6.97TGTYY36 pKa = 9.87SAQLQNGTSVIYY48 pKa = 7.84QTVYY52 pKa = 11.17GDD54 pKa = 3.6FSQPVEE60 pKa = 4.14VSAYY64 pKa = 8.33LAKK67 pKa = 10.71VGASPNPIVSIVLSYY82 pKa = 10.99FDD84 pKa = 4.26NSFNFLGTGLVISIPEE100 pKa = 4.02SNIPDD105 pKa = 3.86VIGGDD110 pKa = 3.16WLKK113 pKa = 11.09AVGTSIPAPVGTDD126 pKa = 3.48FAILSISKK134 pKa = 8.39NTLAGGADD142 pKa = 3.6VLVDD146 pKa = 3.86DD147 pKa = 4.97VSILEE152 pKa = 4.67GPVSPTGPTGPSGPSGPTGPTGPTGPTGPTGPTGPTGPTGPGGGATGPTGPTGPTGPAGATGPTGPAGITGPTGPTGPAGATGPTGPVGPTGPGGGATGPTGPAGATGPTGPTGPAGVTGPTGPVGPTGPGGGATGPTGPAGATGPTGPAGTTGPTGPAGVTGPTGPGGGATGPTGPAGATGPTGPAGATGPTGPAGVTGPTGPIGPTGPGGGATGPTGPAGATGPTGPAGVTGPTGITGTTGPAGATGPTGPAGATGPTGPAGATGPTGPAGTTGPTGPAGVTGPTGADD442 pKa = 3.47GATGPTGPAGSTGPIGPTGPAGSTGPIGPTGPAGSTGPIGPTGPAGSTGPAGSTGPIGPTGPAGSTGPIGPTGPAGSTGPIGPTGPAGSTGPIGPTGPAGSTGPIGPTGPAGSTGPAGVTGATGPAGVTGPTGITGPTGPAGATGPTGPAGATGPTGPAGITGPTGPAGTTGPTGPAGTTGPAGLEE628 pKa = 4.08AFGGLYY634 pKa = 9.25STDD637 pKa = 3.49SQTLSIGIGGGVDD650 pKa = 3.43QIEE653 pKa = 4.51LAEE656 pKa = 4.38TMPSSDD662 pKa = 3.13VTLGTNNITILDD674 pKa = 3.8SGTYY678 pKa = 9.04EE679 pKa = 3.64IEE681 pKa = 4.15YY682 pKa = 8.85MVTVGTVVLAVNLSAGVRR700 pKa = 11.84VNGGTNFIPSTFQTRR715 pKa = 11.84LLSLTLTTLFEE726 pKa = 4.65GSTIVDD732 pKa = 4.36LAAGDD737 pKa = 4.31VIDD740 pKa = 5.71LAVQSTDD747 pKa = 3.16SVSASLTGGLTAYY760 pKa = 8.69LTVKK764 pKa = 10.26KK765 pKa = 10.63ISII768 pKa = 3.97
Molecular weight: 68.85 kDa
Isoelectric point according different methods:
Protein with the highest isoelectric point:
>tr|A0A4U7JIE3|A0A4U7JIE3_9FIRM Iron ABC transporter permease OS=Ruminiclostridium herbifermentans OX=2488810 GN=EHE19_000535 PE=3 SV=1
MM1 pKa = 7.45LRR3 pKa = 11.84TYY5 pKa = 9.82QPKK8 pKa = 9.61KK9 pKa = 8.53RR10 pKa = 11.84HH11 pKa = 5.03RR12 pKa = 11.84QKK14 pKa = 10.33EE15 pKa = 3.73HH16 pKa = 5.99GFRR19 pKa = 11.84KK20 pKa = 10.01RR21 pKa = 11.84MSTANGRR28 pKa = 11.84KK29 pKa = 7.55VLRR32 pKa = 11.84RR33 pKa = 11.84RR34 pKa = 11.84RR35 pKa = 11.84LKK37 pKa = 9.75GRR39 pKa = 11.84KK40 pKa = 9.04VISAA44 pKa = 4.05
MM1 pKa = 7.45LRR3 pKa = 11.84TYY5 pKa = 9.82QPKK8 pKa = 9.61KK9 pKa = 8.53RR10 pKa = 11.84HH11 pKa = 5.03RR12 pKa = 11.84QKK14 pKa = 10.33EE15 pKa = 3.73HH16 pKa = 5.99GFRR19 pKa = 11.84KK20 pKa = 10.01RR21 pKa = 11.84MSTANGRR28 pKa = 11.84KK29 pKa = 7.55VLRR32 pKa = 11.84RR33 pKa = 11.84RR34 pKa = 11.84RR35 pKa = 11.84LKK37 pKa = 9.75GRR39 pKa = 11.84KK40 pKa = 9.04VISAA44 pKa = 4.05
Molecular weight: 5.42 kDa
Isoelectric point according different methods:
Peptides (in silico digests for buttom-up proteomics)
Below you can find in silico digests of the whole proteome with Trypsin, Chymotrypsin, Trypsin+LysC, LysN, ArgC proteases suitable for different mass spec machines.| Try ESI |
 |
|---|
| ChTry ESI |
 |
|---|
| ArgC ESI |
 |
|---|
| LysN ESI |
 |
|---|
| TryLysC ESI |
 |
|---|
| Try MALDI |
 |
|---|
| ChTry MALDI |
 |
|---|
| ArgC MALDI |
 |
|---|
| LysN MALDI |
 |
|---|
| TryLysC MALDI |
 |
|---|
| Try LTQ |
 |
|---|
| ChTry LTQ |
 |
|---|
| ArgC LTQ |
 |
|---|
| LysN LTQ |
 |
|---|
| TryLysC LTQ |
 |
|---|
| Try MSlow |
 |
|---|
| ChTry MSlow |
 |
|---|
| ArgC MSlow |
 |
|---|
| LysN MSlow |
 |
|---|
| TryLysC MSlow |
 |
|---|
| Try MShigh |
 |
|---|
| ChTry MShigh |
 |
|---|
| ArgC MShigh |
 |
|---|
| LysN MShigh |
 |
|---|
| TryLysC MShigh |
 |
|---|
General Statistics
Number of major isoforms |
Number of additional isoforms |
Number of all proteins |
Number of amino acids |
Min. Seq. Length |
Max. Seq. Length |
Avg. Seq. Length |
Avg. Mol. Weight |
|---|---|---|---|---|---|---|---|
0 |
1336279 |
14 |
5773 |
337.7 |
37.92 |
Amino acid frequency
Ala |
Cys |
Asp |
Glu |
Phe |
Gly |
His |
Ile |
Lys |
Leu |
|---|---|---|---|---|---|---|---|---|---|
6.321 ± 0.046 | 1.285 ± 0.016 |
5.629 ± 0.039 | 6.827 ± 0.045 |
4.279 ± 0.041 | 6.521 ± 0.111 |
1.384 ± 0.016 | 9.203 ± 0.058 |
7.957 ± 0.049 | 8.75 ± 0.055 |
Met |
Asn |
Gln |
Pro |
Arg |
Ser |
Thr |
Val |
Trp |
Tyr |
|---|---|---|---|---|---|---|---|---|---|
2.483 ± 0.022 | 6.136 ± 0.043 |
3.147 ± 0.052 | 2.839 ± 0.021 |
3.508 ± 0.031 | 6.714 ± 0.042 |
5.545 ± 0.116 | 6.398 ± 0.035 |
0.852 ± 0.015 | 4.221 ± 0.032 |
Most of the basic statistics you can see at this page can be downloaded from this CSV file
Proteome-pI is available under Creative Commons Attribution-NoDerivs license, for more details see here
| Reference: Kozlowski LP. Proteome-pI 2.0: Proteome Isoelectric Point Database Update. Nucleic Acids Res. 2021, doi: 10.1093/nar/gkab944 | Contact: Lukasz P. Kozlowski |
