Streptomyces sp. HGB0020
Taxonomy: cellular organisms; Bacteria; Terrabacteria group; Actinobacteria; Actinomycetia; Streptomycetales; Streptomycetaceae; Streptomyces; unclassified Streptomyces
Average proteome isoelectric point is 6.34
Get precalculated fractions of proteins

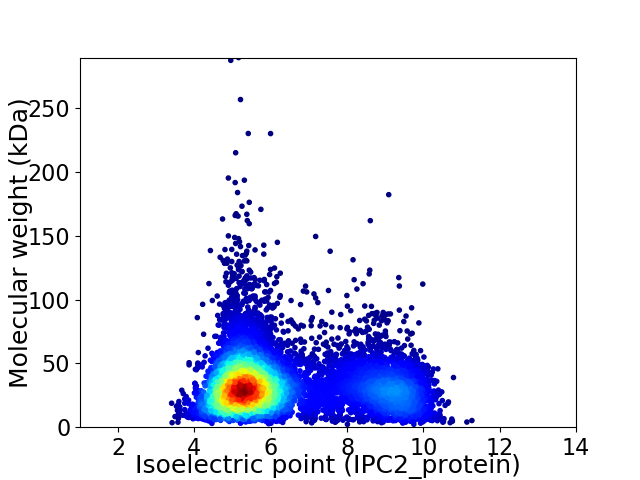
Virtual 2D-PAGE plot for 8369 proteins (isoelectric point calculated using IPC2_protein)
Get csv file with sequences according to given criteria:
* You can choose from 21 different methods for calculating isoelectric point
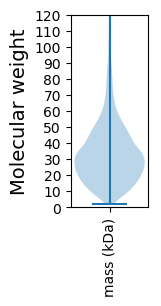
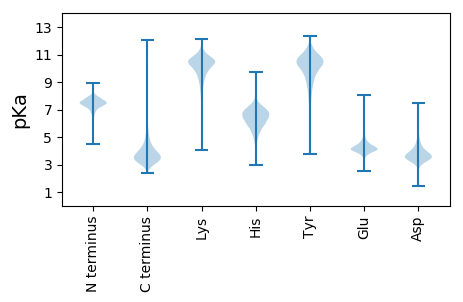
Summary statistics related to proteome-wise predictions


Protein with the lowest isoelectric point:
>tr|S2YFN9|S2YFN9_9ACTN IMP dehydrogenase OS=Streptomyces sp. HGB0020 OX=1078086 GN=HMPREF1211_04756 PE=3 SV=1
MM1 pKa = 7.83RR2 pKa = 11.84SRR4 pKa = 11.84PARR7 pKa = 11.84HH8 pKa = 5.88RR9 pKa = 11.84LIGAVPAVTLALGAALAVPLTTAGSAAAATTPATASVNEE48 pKa = 4.16YY49 pKa = 10.49DD50 pKa = 3.11WQLTYY55 pKa = 10.68RR56 pKa = 11.84AAPGQANTAMVTASYY71 pKa = 8.9TADD74 pKa = 3.4RR75 pKa = 11.84TGFTYY80 pKa = 10.8VIDD83 pKa = 4.08DD84 pKa = 4.21VVPIDD89 pKa = 4.23AGHH92 pKa = 6.58GCTYY96 pKa = 10.96LDD98 pKa = 3.23TSDD101 pKa = 3.61RR102 pKa = 11.84TKK104 pKa = 10.85VSCTVADD111 pKa = 4.15VEE113 pKa = 4.85SQDD116 pKa = 3.92PYY118 pKa = 10.5PALVMDD124 pKa = 5.73LGDD127 pKa = 4.73GDD129 pKa = 5.89DD130 pKa = 3.53KK131 pKa = 11.55AAYY134 pKa = 10.13NNATGQVYY142 pKa = 10.05SYY144 pKa = 11.97AEE146 pKa = 3.84ISLGAGDD153 pKa = 4.91DD154 pKa = 3.82HH155 pKa = 8.96AIDD158 pKa = 3.58TGRR161 pKa = 11.84LDD163 pKa = 3.28GAYY166 pKa = 10.46VSGDD170 pKa = 3.51AGDD173 pKa = 3.87DD174 pKa = 4.07TITVGADD181 pKa = 3.13GFAWGGDD188 pKa = 3.71DD189 pKa = 5.23NDD191 pKa = 4.62TIFANGGDD199 pKa = 4.01NIVKK203 pKa = 10.44GGAGDD208 pKa = 4.49DD209 pKa = 3.96EE210 pKa = 4.82LHH212 pKa = 6.76GGDD215 pKa = 4.3GAQDD219 pKa = 3.7LSGDD223 pKa = 4.09DD224 pKa = 4.98GNDD227 pKa = 3.15TLYY230 pKa = 11.24GGTGDD235 pKa = 4.01DD236 pKa = 3.57SLYY239 pKa = 10.85GGKK242 pKa = 10.66GNDD245 pKa = 3.21VIYY248 pKa = 10.71GNSGNDD254 pKa = 3.36TLYY257 pKa = 11.29GNSGNDD263 pKa = 3.38TLYY266 pKa = 10.99GGPGTDD272 pKa = 3.65TLSGGPGTNVIHH284 pKa = 6.93QDD286 pKa = 2.99
MM1 pKa = 7.83RR2 pKa = 11.84SRR4 pKa = 11.84PARR7 pKa = 11.84HH8 pKa = 5.88RR9 pKa = 11.84LIGAVPAVTLALGAALAVPLTTAGSAAAATTPATASVNEE48 pKa = 4.16YY49 pKa = 10.49DD50 pKa = 3.11WQLTYY55 pKa = 10.68RR56 pKa = 11.84AAPGQANTAMVTASYY71 pKa = 8.9TADD74 pKa = 3.4RR75 pKa = 11.84TGFTYY80 pKa = 10.8VIDD83 pKa = 4.08DD84 pKa = 4.21VVPIDD89 pKa = 4.23AGHH92 pKa = 6.58GCTYY96 pKa = 10.96LDD98 pKa = 3.23TSDD101 pKa = 3.61RR102 pKa = 11.84TKK104 pKa = 10.85VSCTVADD111 pKa = 4.15VEE113 pKa = 4.85SQDD116 pKa = 3.92PYY118 pKa = 10.5PALVMDD124 pKa = 5.73LGDD127 pKa = 4.73GDD129 pKa = 5.89DD130 pKa = 3.53KK131 pKa = 11.55AAYY134 pKa = 10.13NNATGQVYY142 pKa = 10.05SYY144 pKa = 11.97AEE146 pKa = 3.84ISLGAGDD153 pKa = 4.91DD154 pKa = 3.82HH155 pKa = 8.96AIDD158 pKa = 3.58TGRR161 pKa = 11.84LDD163 pKa = 3.28GAYY166 pKa = 10.46VSGDD170 pKa = 3.51AGDD173 pKa = 3.87DD174 pKa = 4.07TITVGADD181 pKa = 3.13GFAWGGDD188 pKa = 3.71DD189 pKa = 5.23NDD191 pKa = 4.62TIFANGGDD199 pKa = 4.01NIVKK203 pKa = 10.44GGAGDD208 pKa = 4.49DD209 pKa = 3.96EE210 pKa = 4.82LHH212 pKa = 6.76GGDD215 pKa = 4.3GAQDD219 pKa = 3.7LSGDD223 pKa = 4.09DD224 pKa = 4.98GNDD227 pKa = 3.15TLYY230 pKa = 11.24GGTGDD235 pKa = 4.01DD236 pKa = 3.57SLYY239 pKa = 10.85GGKK242 pKa = 10.66GNDD245 pKa = 3.21VIYY248 pKa = 10.71GNSGNDD254 pKa = 3.36TLYY257 pKa = 11.29GNSGNDD263 pKa = 3.38TLYY266 pKa = 10.99GGPGTDD272 pKa = 3.65TLSGGPGTNVIHH284 pKa = 6.93QDD286 pKa = 2.99
Molecular weight: 28.94 kDa
Isoelectric point according different methods:
Protein with the highest isoelectric point:
>tr|S2XUW4|S2XUW4_9ACTN NADH-quinone oxidoreductase subunit H OS=Streptomyces sp. HGB0020 OX=1078086 GN=nuoH PE=3 SV=1
MM1 pKa = 7.69SKK3 pKa = 9.0RR4 pKa = 11.84TFQPNNRR11 pKa = 11.84RR12 pKa = 11.84RR13 pKa = 11.84AKK15 pKa = 8.7THH17 pKa = 5.15GFRR20 pKa = 11.84LRR22 pKa = 11.84MRR24 pKa = 11.84TRR26 pKa = 11.84AGRR29 pKa = 11.84AILANRR35 pKa = 11.84RR36 pKa = 11.84AKK38 pKa = 10.46GRR40 pKa = 11.84ASLSAA45 pKa = 3.83
MM1 pKa = 7.69SKK3 pKa = 9.0RR4 pKa = 11.84TFQPNNRR11 pKa = 11.84RR12 pKa = 11.84RR13 pKa = 11.84AKK15 pKa = 8.7THH17 pKa = 5.15GFRR20 pKa = 11.84LRR22 pKa = 11.84MRR24 pKa = 11.84TRR26 pKa = 11.84AGRR29 pKa = 11.84AILANRR35 pKa = 11.84RR36 pKa = 11.84AKK38 pKa = 10.46GRR40 pKa = 11.84ASLSAA45 pKa = 3.83
Molecular weight: 5.22 kDa
Isoelectric point according different methods:
Peptides (in silico digests for buttom-up proteomics)
Below you can find in silico digests of the whole proteome with Trypsin, Chymotrypsin, Trypsin+LysC, LysN, ArgC proteases suitable for different mass spec machines.| Try ESI |
 |
|---|
| ChTry ESI |
 |
|---|
| ArgC ESI |
 |
|---|
| LysN ESI |
 |
|---|
| TryLysC ESI |
 |
|---|
| Try MALDI |
 |
|---|
| ChTry MALDI |
 |
|---|
| ArgC MALDI |
 |
|---|
| LysN MALDI |
 |
|---|
| TryLysC MALDI |
 |
|---|
| Try LTQ |
 |
|---|
| ChTry LTQ |
 |
|---|
| ArgC LTQ |
 |
|---|
| LysN LTQ |
 |
|---|
| TryLysC LTQ |
 |
|---|
| Try MSlow |
 |
|---|
| ChTry MSlow |
 |
|---|
| ArgC MSlow |
 |
|---|
| LysN MSlow |
 |
|---|
| TryLysC MSlow |
 |
|---|
| Try MShigh |
 |
|---|
| ChTry MShigh |
 |
|---|
| ArgC MShigh |
 |
|---|
| LysN MShigh |
 |
|---|
| TryLysC MShigh |
 |
|---|
General Statistics
Number of major isoforms |
Number of additional isoforms |
Number of all proteins |
Number of amino acids |
Min. Seq. Length |
Max. Seq. Length |
Avg. Seq. Length |
Avg. Mol. Weight |
|---|---|---|---|---|---|---|---|
0 |
2744775 |
20 |
2763 |
328.0 |
35.2 |
Amino acid frequency
Ala |
Cys |
Asp |
Glu |
Phe |
Gly |
His |
Ile |
Lys |
Leu |
|---|---|---|---|---|---|---|---|---|---|
13.258 ± 0.034 | 0.784 ± 0.007 |
6.048 ± 0.024 | 5.641 ± 0.028 |
2.78 ± 0.014 | 9.318 ± 0.029 |
2.369 ± 0.014 | 3.242 ± 0.017 |
2.274 ± 0.022 | 10.283 ± 0.035 |
Met |
Asn |
Gln |
Pro |
Arg |
Ser |
Thr |
Val |
Trp |
Tyr |
|---|---|---|---|---|---|---|---|---|---|
1.762 ± 0.011 | 1.841 ± 0.016 |
5.986 ± 0.026 | 2.893 ± 0.016 |
7.894 ± 0.035 | 5.201 ± 0.022 |
6.229 ± 0.023 | 8.49 ± 0.024 |
1.543 ± 0.01 | 2.166 ± 0.014 |
Most of the basic statistics you can see at this page can be downloaded from this CSV file
Proteome-pI is available under Creative Commons Attribution-NoDerivs license, for more details see here
| Reference: Kozlowski LP. Proteome-pI 2.0: Proteome Isoelectric Point Database Update. Nucleic Acids Res. 2021, doi: 10.1093/nar/gkab944 | Contact: Lukasz P. Kozlowski |
