Eubacterium sp. CAG:251
Taxonomy: cellular organisms; Bacteria; Terrabacteria group; Firmicutes; Clostridia; Eubacteriales; Eubacteriaceae; Eubacterium; environmental samples
Average proteome isoelectric point is 6.34
Get precalculated fractions of proteins

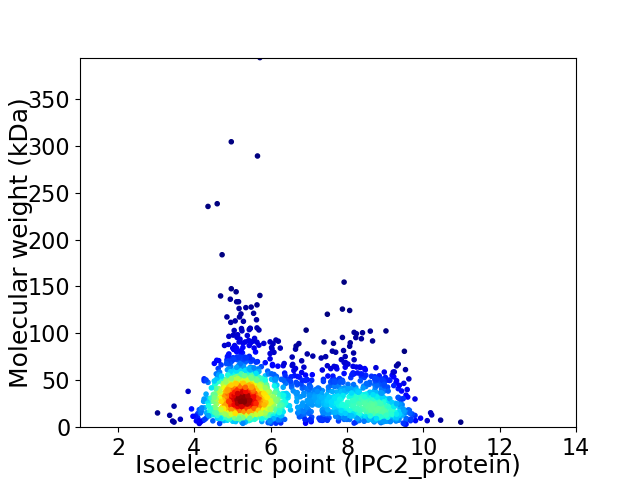
Virtual 2D-PAGE plot for 1717 proteins (isoelectric point calculated using IPC2_protein)
Get csv file with sequences according to given criteria:
* You can choose from 21 different methods for calculating isoelectric point
Summary statistics related to proteome-wise predictions


Protein with the lowest isoelectric point:
>tr|R6QJ07|R6QJ07_9FIRM UDP-N-acetylglucosamine 1-carboxyvinyltransferase OS=Eubacterium sp. CAG:251 OX=1262886 GN=murA PE=3 SV=1
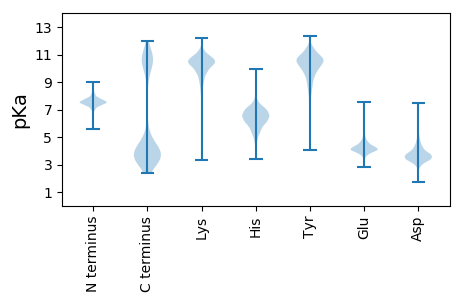
MM1 pKa = 7.47KK2 pKa = 10.34KK3 pKa = 10.12IITIFLGVCISIFFVSCSTPYY24 pKa = 10.78YY25 pKa = 9.42NQNSDD30 pKa = 4.5LPNANNTKK38 pKa = 10.73DD39 pKa = 3.89FIHH42 pKa = 6.93YY43 pKa = 9.33EE44 pKa = 4.13VEE46 pKa = 3.65FDD48 pKa = 4.31IPNEE52 pKa = 3.84YY53 pKa = 8.65TAYY56 pKa = 9.5STDD59 pKa = 3.2NEE61 pKa = 5.1FYY63 pKa = 10.64TEE65 pKa = 5.83LIINDD70 pKa = 4.02NIDD73 pKa = 3.03VRR75 pKa = 11.84KK76 pKa = 9.82FKK78 pKa = 10.99EE79 pKa = 4.09EE80 pKa = 4.06NDD82 pKa = 3.44NTDD85 pKa = 3.14CDD87 pKa = 4.23VYY89 pKa = 10.5FTDD92 pKa = 6.37EE93 pKa = 4.92IIDD96 pKa = 3.83SNAEE100 pKa = 3.88VIYY103 pKa = 9.95TLVFEE108 pKa = 4.56FNCYY112 pKa = 10.32DD113 pKa = 3.77EE114 pKa = 4.85NDD116 pKa = 3.65NLIDD120 pKa = 3.92TIYY123 pKa = 9.46FTDD126 pKa = 3.55TLGDD130 pKa = 3.43KK131 pKa = 10.76QGIGGEE137 pKa = 4.3NVLSSTVNEE146 pKa = 4.79SVRR149 pKa = 11.84KK150 pKa = 8.93MKK152 pKa = 10.61FSKK155 pKa = 10.9AFLADD160 pKa = 3.69LNEE163 pKa = 4.09VQFYY167 pKa = 10.46NN168 pKa = 4.14
MM1 pKa = 7.47KK2 pKa = 10.34KK3 pKa = 10.12IITIFLGVCISIFFVSCSTPYY24 pKa = 10.78YY25 pKa = 9.42NQNSDD30 pKa = 4.5LPNANNTKK38 pKa = 10.73DD39 pKa = 3.89FIHH42 pKa = 6.93YY43 pKa = 9.33EE44 pKa = 4.13VEE46 pKa = 3.65FDD48 pKa = 4.31IPNEE52 pKa = 3.84YY53 pKa = 8.65TAYY56 pKa = 9.5STDD59 pKa = 3.2NEE61 pKa = 5.1FYY63 pKa = 10.64TEE65 pKa = 5.83LIINDD70 pKa = 4.02NIDD73 pKa = 3.03VRR75 pKa = 11.84KK76 pKa = 9.82FKK78 pKa = 10.99EE79 pKa = 4.09EE80 pKa = 4.06NDD82 pKa = 3.44NTDD85 pKa = 3.14CDD87 pKa = 4.23VYY89 pKa = 10.5FTDD92 pKa = 6.37EE93 pKa = 4.92IIDD96 pKa = 3.83SNAEE100 pKa = 3.88VIYY103 pKa = 9.95TLVFEE108 pKa = 4.56FNCYY112 pKa = 10.32DD113 pKa = 3.77EE114 pKa = 4.85NDD116 pKa = 3.65NLIDD120 pKa = 3.92TIYY123 pKa = 9.46FTDD126 pKa = 3.55TLGDD130 pKa = 3.43KK131 pKa = 10.76QGIGGEE137 pKa = 4.3NVLSSTVNEE146 pKa = 4.79SVRR149 pKa = 11.84KK150 pKa = 8.93MKK152 pKa = 10.61FSKK155 pKa = 10.9AFLADD160 pKa = 3.69LNEE163 pKa = 4.09VQFYY167 pKa = 10.46NN168 pKa = 4.14
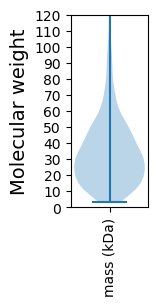
Molecular weight: 19.5 kDa
Isoelectric point according different methods:
Protein with the highest isoelectric point:
>tr|R6QRZ9|R6QRZ9_9FIRM Protein translocase subunit SecA OS=Eubacterium sp. CAG:251 OX=1262886 GN=secA PE=3 SV=1
MM1 pKa = 7.88AYY3 pKa = 10.15NRR5 pKa = 11.84AGGPRR10 pKa = 11.84KK11 pKa = 9.57GRR13 pKa = 11.84KK14 pKa = 8.43KK15 pKa = 9.76VCVFCVEE22 pKa = 4.21KK23 pKa = 10.85VDD25 pKa = 4.4EE26 pKa = 4.47IDD28 pKa = 3.79YY29 pKa = 11.26KK30 pKa = 11.3DD31 pKa = 3.38VTRR34 pKa = 11.84LKK36 pKa = 10.53RR37 pKa = 11.84FVSEE41 pKa = 3.99RR42 pKa = 11.84SKK44 pKa = 10.61ILPRR48 pKa = 11.84RR49 pKa = 11.84VTGTCAKK56 pKa = 9.65HH57 pKa = 5.38QRR59 pKa = 11.84EE60 pKa = 4.47LTTAIKK66 pKa = 10.25RR67 pKa = 11.84ARR69 pKa = 11.84HH70 pKa = 5.41LALLPYY76 pKa = 10.25TSDD79 pKa = 3.02
MM1 pKa = 7.88AYY3 pKa = 10.15NRR5 pKa = 11.84AGGPRR10 pKa = 11.84KK11 pKa = 9.57GRR13 pKa = 11.84KK14 pKa = 8.43KK15 pKa = 9.76VCVFCVEE22 pKa = 4.21KK23 pKa = 10.85VDD25 pKa = 4.4EE26 pKa = 4.47IDD28 pKa = 3.79YY29 pKa = 11.26KK30 pKa = 11.3DD31 pKa = 3.38VTRR34 pKa = 11.84LKK36 pKa = 10.53RR37 pKa = 11.84FVSEE41 pKa = 3.99RR42 pKa = 11.84SKK44 pKa = 10.61ILPRR48 pKa = 11.84RR49 pKa = 11.84VTGTCAKK56 pKa = 9.65HH57 pKa = 5.38QRR59 pKa = 11.84EE60 pKa = 4.47LTTAIKK66 pKa = 10.25RR67 pKa = 11.84ARR69 pKa = 11.84HH70 pKa = 5.41LALLPYY76 pKa = 10.25TSDD79 pKa = 3.02
Molecular weight: 9.13 kDa
Isoelectric point according different methods:
Peptides (in silico digests for buttom-up proteomics)
Below you can find in silico digests of the whole proteome with Trypsin, Chymotrypsin, Trypsin+LysC, LysN, ArgC proteases suitable for different mass spec machines.| Try ESI |
 |
|---|
| ChTry ESI |
 |
|---|
| ArgC ESI |
 |
|---|
| LysN ESI |
 |
|---|
| TryLysC ESI |
 |
|---|
| Try MALDI |
 |
|---|
| ChTry MALDI |
 |
|---|
| ArgC MALDI |
 |
|---|
| LysN MALDI |
 |
|---|
| TryLysC MALDI |
 |
|---|
| Try LTQ |
 |
|---|
| ChTry LTQ |
 |
|---|
| ArgC LTQ |
 |
|---|
| LysN LTQ |
 |
|---|
| TryLysC LTQ |
 |
|---|
| Try MSlow |
 |
|---|
| ChTry MSlow |
 |
|---|
| ArgC MSlow |
 |
|---|
| LysN MSlow |
 |
|---|
| TryLysC MSlow |
 |
|---|
| Try MShigh |
 |
|---|
| ChTry MShigh |
 |
|---|
| ArgC MShigh |
 |
|---|
| LysN MShigh |
 |
|---|
| TryLysC MShigh |
 |
|---|
General Statistics
Number of major isoforms |
Number of additional isoforms |
Number of all proteins |
Number of amino acids |
Min. Seq. Length |
Max. Seq. Length |
Avg. Seq. Length |
Avg. Mol. Weight |
|---|---|---|---|---|---|---|---|
0 |
555267 |
29 |
3485 |
323.4 |
36.16 |
Amino acid frequency
Ala |
Cys |
Asp |
Glu |
Phe |
Gly |
His |
Ile |
Lys |
Leu |
|---|---|---|---|---|---|---|---|---|---|
7.179 ± 0.06 | 1.68 ± 0.025 |
6.222 ± 0.048 | 6.492 ± 0.065 |
4.488 ± 0.044 | 6.619 ± 0.057 |
1.452 ± 0.024 | 8.06 ± 0.054 |
8.562 ± 0.061 | 8.209 ± 0.06 |
Met |
Asn |
Gln |
Pro |
Arg |
Ser |
Thr |
Val |
Trp |
Tyr |
|---|---|---|---|---|---|---|---|---|---|
2.61 ± 0.029 | 5.761 ± 0.065 |
3.014 ± 0.033 | 2.532 ± 0.028 |
3.324 ± 0.045 | 6.469 ± 0.053 |
5.507 ± 0.052 | 6.846 ± 0.053 |
0.749 ± 0.021 | 4.224 ± 0.043 |
Most of the basic statistics you can see at this page can be downloaded from this CSV file
Proteome-pI is available under Creative Commons Attribution-NoDerivs license, for more details see here
| Reference: Kozlowski LP. Proteome-pI 2.0: Proteome Isoelectric Point Database Update. Nucleic Acids Res. 2021, doi: 10.1093/nar/gkab944 | Contact: Lukasz P. Kozlowski |
