Enterococcus cecorum DSM 20682 = ATCC 43198
Taxonomy: cellular organisms; Bacteria; Terrabacteria group; Firmicutes; Bacilli; Lactobacillales; Enterococcaceae; Enterococcus; Enterococcus cecorum
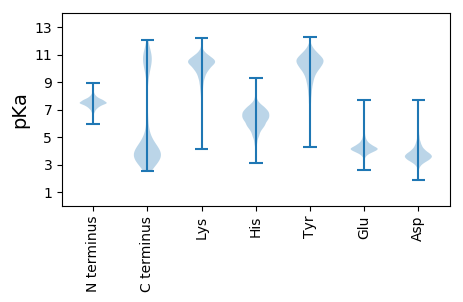
Average proteome isoelectric point is 6.39
Get precalculated fractions of proteins

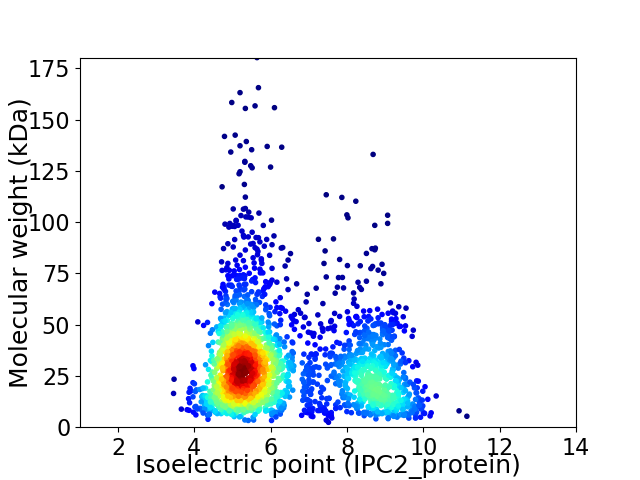
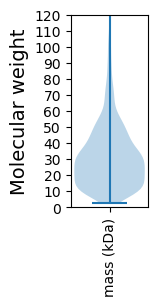
Virtual 2D-PAGE plot for 2361 proteins (isoelectric point calculated using IPC2_protein)
Get csv file with sequences according to given criteria:
* You can choose from 21 different methods for calculating isoelectric point
Summary statistics related to proteome-wise predictions


Protein with the lowest isoelectric point:
>tr|S1QX95|S1QX95_9ENTE 3-hydroxyacyl-[acyl-carrier-protein] dehydratase FabZ OS=Enterococcus cecorum DSM 20682 = ATCC 43198 OX=1121864 GN=fabZ PE=3 SV=1
MM1 pKa = 7.05IVAYY5 pKa = 7.31EE6 pKa = 4.12TFAFVYY12 pKa = 10.37DD13 pKa = 3.92EE14 pKa = 4.82VMDD17 pKa = 3.83TSLYY21 pKa = 10.05QRR23 pKa = 11.84WLDD26 pKa = 3.43FSLRR30 pKa = 11.84FLGDD34 pKa = 2.98RR35 pKa = 11.84KK36 pKa = 10.46RR37 pKa = 11.84ILEE40 pKa = 4.24LACGTGALALDD51 pKa = 4.53FAKK54 pKa = 10.74SGFDD58 pKa = 3.31VTALDD63 pKa = 4.28LSEE66 pKa = 4.4EE67 pKa = 4.16MLMIASSRR75 pKa = 11.84AQEE78 pKa = 3.98ADD80 pKa = 2.85VDD82 pKa = 3.92IQFVEE87 pKa = 4.21GDD89 pKa = 3.91MLDD92 pKa = 3.48LTDD95 pKa = 3.72IDD97 pKa = 3.68TYY99 pKa = 11.29EE100 pKa = 4.18AVTCFSDD107 pKa = 3.93SICYY111 pKa = 9.44MEE113 pKa = 6.02DD114 pKa = 3.2EE115 pKa = 4.39QAVQQVFDD123 pKa = 3.7GVYY126 pKa = 10.3QILEE130 pKa = 4.16EE131 pKa = 4.18NGVFIFDD138 pKa = 3.44VHH140 pKa = 5.31STYY143 pKa = 10.77QIDD146 pKa = 4.25EE147 pKa = 4.25VFPDD151 pKa = 3.5YY152 pKa = 10.85SYY154 pKa = 11.22HH155 pKa = 5.76YY156 pKa = 8.56QTEE159 pKa = 4.21DD160 pKa = 4.2FAFLWDD166 pKa = 3.98SYY168 pKa = 11.74AVDD171 pKa = 3.78VPHH174 pKa = 7.51SIEE177 pKa = 4.04HH178 pKa = 6.42FLTFFVQNEE187 pKa = 4.03DD188 pKa = 3.52GLFEE192 pKa = 4.48RR193 pKa = 11.84RR194 pKa = 11.84DD195 pKa = 3.57EE196 pKa = 4.03IHH198 pKa = 7.27RR199 pKa = 11.84EE200 pKa = 3.33RR201 pKa = 11.84TYY203 pKa = 11.14PLNQYY208 pKa = 11.5LMMLEE213 pKa = 3.89NAGFAKK219 pKa = 10.55VEE221 pKa = 4.22AYY223 pKa = 10.67ADD225 pKa = 4.64FIDD228 pKa = 4.68SEE230 pKa = 4.61PNEE233 pKa = 4.01KK234 pKa = 9.92SRR236 pKa = 11.84RR237 pKa = 11.84WFFVCEE243 pKa = 3.94KK244 pKa = 10.79
MM1 pKa = 7.05IVAYY5 pKa = 7.31EE6 pKa = 4.12TFAFVYY12 pKa = 10.37DD13 pKa = 3.92EE14 pKa = 4.82VMDD17 pKa = 3.83TSLYY21 pKa = 10.05QRR23 pKa = 11.84WLDD26 pKa = 3.43FSLRR30 pKa = 11.84FLGDD34 pKa = 2.98RR35 pKa = 11.84KK36 pKa = 10.46RR37 pKa = 11.84ILEE40 pKa = 4.24LACGTGALALDD51 pKa = 4.53FAKK54 pKa = 10.74SGFDD58 pKa = 3.31VTALDD63 pKa = 4.28LSEE66 pKa = 4.4EE67 pKa = 4.16MLMIASSRR75 pKa = 11.84AQEE78 pKa = 3.98ADD80 pKa = 2.85VDD82 pKa = 3.92IQFVEE87 pKa = 4.21GDD89 pKa = 3.91MLDD92 pKa = 3.48LTDD95 pKa = 3.72IDD97 pKa = 3.68TYY99 pKa = 11.29EE100 pKa = 4.18AVTCFSDD107 pKa = 3.93SICYY111 pKa = 9.44MEE113 pKa = 6.02DD114 pKa = 3.2EE115 pKa = 4.39QAVQQVFDD123 pKa = 3.7GVYY126 pKa = 10.3QILEE130 pKa = 4.16EE131 pKa = 4.18NGVFIFDD138 pKa = 3.44VHH140 pKa = 5.31STYY143 pKa = 10.77QIDD146 pKa = 4.25EE147 pKa = 4.25VFPDD151 pKa = 3.5YY152 pKa = 10.85SYY154 pKa = 11.22HH155 pKa = 5.76YY156 pKa = 8.56QTEE159 pKa = 4.21DD160 pKa = 4.2FAFLWDD166 pKa = 3.98SYY168 pKa = 11.74AVDD171 pKa = 3.78VPHH174 pKa = 7.51SIEE177 pKa = 4.04HH178 pKa = 6.42FLTFFVQNEE187 pKa = 4.03DD188 pKa = 3.52GLFEE192 pKa = 4.48RR193 pKa = 11.84RR194 pKa = 11.84DD195 pKa = 3.57EE196 pKa = 4.03IHH198 pKa = 7.27RR199 pKa = 11.84EE200 pKa = 3.33RR201 pKa = 11.84TYY203 pKa = 11.14PLNQYY208 pKa = 11.5LMMLEE213 pKa = 3.89NAGFAKK219 pKa = 10.55VEE221 pKa = 4.22AYY223 pKa = 10.67ADD225 pKa = 4.64FIDD228 pKa = 4.68SEE230 pKa = 4.61PNEE233 pKa = 4.01KK234 pKa = 9.92SRR236 pKa = 11.84RR237 pKa = 11.84WFFVCEE243 pKa = 3.94KK244 pKa = 10.79
Molecular weight: 28.59 kDa
Isoelectric point according different methods:
Protein with the highest isoelectric point:
>tr|S1RPZ6|S1RPZ6_9ENTE Uncharacterized protein OS=Enterococcus cecorum DSM 20682 = ATCC 43198 OX=1121864 GN=OMO_01749 PE=4 SV=1
MM1 pKa = 7.35KK2 pKa = 9.42RR3 pKa = 11.84TYY5 pKa = 10.34QPNKK9 pKa = 9.16RR10 pKa = 11.84KK11 pKa = 9.12RR12 pKa = 11.84QKK14 pKa = 9.38VHH16 pKa = 5.8GFRR19 pKa = 11.84KK20 pKa = 10.04RR21 pKa = 11.84MSTKK25 pKa = 9.46NGRR28 pKa = 11.84RR29 pKa = 11.84VLASRR34 pKa = 11.84RR35 pKa = 11.84RR36 pKa = 11.84KK37 pKa = 8.8GRR39 pKa = 11.84KK40 pKa = 8.76VLAAA44 pKa = 4.31
MM1 pKa = 7.35KK2 pKa = 9.42RR3 pKa = 11.84TYY5 pKa = 10.34QPNKK9 pKa = 9.16RR10 pKa = 11.84KK11 pKa = 9.12RR12 pKa = 11.84QKK14 pKa = 9.38VHH16 pKa = 5.8GFRR19 pKa = 11.84KK20 pKa = 10.04RR21 pKa = 11.84MSTKK25 pKa = 9.46NGRR28 pKa = 11.84RR29 pKa = 11.84VLASRR34 pKa = 11.84RR35 pKa = 11.84RR36 pKa = 11.84KK37 pKa = 8.8GRR39 pKa = 11.84KK40 pKa = 8.76VLAAA44 pKa = 4.31
Molecular weight: 5.34 kDa
Isoelectric point according different methods:
Peptides (in silico digests for buttom-up proteomics)
Below you can find in silico digests of the whole proteome with Trypsin, Chymotrypsin, Trypsin+LysC, LysN, ArgC proteases suitable for different mass spec machines.| Try ESI |
 |
|---|
| ChTry ESI |
 |
|---|
| ArgC ESI |
 |
|---|
| LysN ESI |
 |
|---|
| TryLysC ESI |
 |
|---|
| Try MALDI |
 |
|---|
| ChTry MALDI |
 |
|---|
| ArgC MALDI |
 |
|---|
| LysN MALDI |
 |
|---|
| TryLysC MALDI |
 |
|---|
| Try LTQ |
 |
|---|
| ChTry LTQ |
 |
|---|
| ArgC LTQ |
 |
|---|
| LysN LTQ |
 |
|---|
| TryLysC LTQ |
 |
|---|
| Try MSlow |
 |
|---|
| ChTry MSlow |
 |
|---|
| ArgC MSlow |
 |
|---|
| LysN MSlow |
 |
|---|
| TryLysC MSlow |
 |
|---|
| Try MShigh |
 |
|---|
| ChTry MShigh |
 |
|---|
| ArgC MShigh |
 |
|---|
| LysN MShigh |
 |
|---|
| TryLysC MShigh |
 |
|---|
General Statistics
Number of major isoforms |
Number of additional isoforms |
Number of all proteins |
Number of amino acids |
Min. Seq. Length |
Max. Seq. Length |
Avg. Seq. Length |
Avg. Mol. Weight |
|---|---|---|---|---|---|---|---|
0 |
690344 |
20 |
1631 |
292.4 |
33.03 |
Amino acid frequency
Ala |
Cys |
Asp |
Glu |
Phe |
Gly |
His |
Ile |
Lys |
Leu |
|---|---|---|---|---|---|---|---|---|---|
7.18 ± 0.059 | 0.781 ± 0.016 |
5.229 ± 0.039 | 7.023 ± 0.05 |
4.63 ± 0.04 | 6.137 ± 0.049 |
2.048 ± 0.022 | 7.543 ± 0.051 |
7.182 ± 0.044 | 10.013 ± 0.056 |
Met |
Asn |
Gln |
Pro |
Arg |
Ser |
Thr |
Val |
Trp |
Tyr |
|---|---|---|---|---|---|---|---|---|---|
2.711 ± 0.025 | 4.739 ± 0.038 |
3.34 ± 0.023 | 4.959 ± 0.053 |
3.829 ± 0.039 | 5.666 ± 0.038 |
5.448 ± 0.037 | 6.711 ± 0.04 |
0.861 ± 0.018 | 3.972 ± 0.034 |
Most of the basic statistics you can see at this page can be downloaded from this CSV file
Proteome-pI is available under Creative Commons Attribution-NoDerivs license, for more details see here
| Reference: Kozlowski LP. Proteome-pI 2.0: Proteome Isoelectric Point Database Update. Nucleic Acids Res. 2021, doi: 10.1093/nar/gkab944 | Contact: Lukasz P. Kozlowski |
