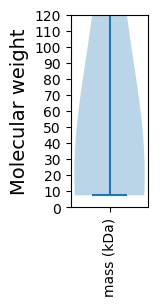
Equine arteritis virus (EAV)
Taxonomy: Viruses; Riboviria; Orthornavirae; Pisuviricota; Pisoniviricetes; Nidovirales; Arnidovirineae; Arteriviridae; Equarterivirinae; Alphaarterivirus; Alphaarterivirus equid
Average proteome isoelectric point is 7.94
Get precalculated fractions of proteins

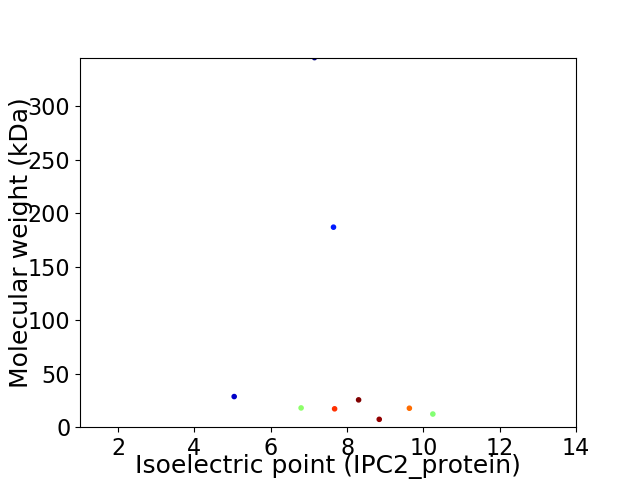
Virtual 2D-PAGE plot for 9 proteins (isoelectric point calculated using IPC2_protein)
Get csv file with sequences according to given criteria:
* You can choose from 21 different methods for calculating isoelectric point
Summary statistics related to proteome-wise predictions


Protein with the lowest isoelectric point:
>tr|Q77S93|Q77S93_EAV Nucleocapsid protein OS=Equine arteritis virus OX=11047 GN=N PE=3 SV=1
MM1 pKa = 7.93LSMIVLLSLLWGAPSHH17 pKa = 6.92AYY19 pKa = 9.84FSYY22 pKa = 9.49YY23 pKa = 8.13TAQRR27 pKa = 11.84FTDD30 pKa = 4.11FTLCMLTDD38 pKa = 3.67RR39 pKa = 11.84GVIANLLRR47 pKa = 11.84YY48 pKa = 9.57DD49 pKa = 3.76EE50 pKa = 4.59HH51 pKa = 6.15TALYY55 pKa = 9.8NCSASKK61 pKa = 8.89TCWYY65 pKa = 8.61CTFLDD70 pKa = 3.81EE71 pKa = 5.32QIITFGTDD79 pKa = 2.85CNDD82 pKa = 3.21TYY84 pKa = 11.41AVPVAEE90 pKa = 4.74VLEE93 pKa = 4.4QAHH96 pKa = 6.21GLYY99 pKa = 10.49SVLFDD104 pKa = 4.99DD105 pKa = 5.08MPPFIYY111 pKa = 10.25YY112 pKa = 10.11GRR114 pKa = 11.84EE115 pKa = 3.52FGIVVLDD122 pKa = 3.16VFMFYY127 pKa = 10.43PVLVLFFLSVLPYY140 pKa = 9.36ATLILEE146 pKa = 4.33MCVSILFIIYY156 pKa = 9.84GIYY159 pKa = 10.04SGAYY163 pKa = 7.89LAMGIFAATLAIHH176 pKa = 6.54SIVVLRR182 pKa = 11.84QLLWLCLAWRR192 pKa = 11.84YY193 pKa = 10.1RR194 pKa = 11.84CTLHH198 pKa = 7.36ASFISAEE205 pKa = 4.12GKK207 pKa = 10.25VYY209 pKa = 10.23PVDD212 pKa = 4.17PGLPVAAAGNRR223 pKa = 11.84LLVPGRR229 pKa = 11.84PTIDD233 pKa = 3.26YY234 pKa = 10.46AVAYY238 pKa = 8.79GSKK241 pKa = 10.62VNLVRR246 pKa = 11.84LGAAEE251 pKa = 3.88VWEE254 pKa = 4.33PP255 pKa = 3.68
MM1 pKa = 7.93LSMIVLLSLLWGAPSHH17 pKa = 6.92AYY19 pKa = 9.84FSYY22 pKa = 9.49YY23 pKa = 8.13TAQRR27 pKa = 11.84FTDD30 pKa = 4.11FTLCMLTDD38 pKa = 3.67RR39 pKa = 11.84GVIANLLRR47 pKa = 11.84YY48 pKa = 9.57DD49 pKa = 3.76EE50 pKa = 4.59HH51 pKa = 6.15TALYY55 pKa = 9.8NCSASKK61 pKa = 8.89TCWYY65 pKa = 8.61CTFLDD70 pKa = 3.81EE71 pKa = 5.32QIITFGTDD79 pKa = 2.85CNDD82 pKa = 3.21TYY84 pKa = 11.41AVPVAEE90 pKa = 4.74VLEE93 pKa = 4.4QAHH96 pKa = 6.21GLYY99 pKa = 10.49SVLFDD104 pKa = 4.99DD105 pKa = 5.08MPPFIYY111 pKa = 10.25YY112 pKa = 10.11GRR114 pKa = 11.84EE115 pKa = 3.52FGIVVLDD122 pKa = 3.16VFMFYY127 pKa = 10.43PVLVLFFLSVLPYY140 pKa = 9.36ATLILEE146 pKa = 4.33MCVSILFIIYY156 pKa = 9.84GIYY159 pKa = 10.04SGAYY163 pKa = 7.89LAMGIFAATLAIHH176 pKa = 6.54SIVVLRR182 pKa = 11.84QLLWLCLAWRR192 pKa = 11.84YY193 pKa = 10.1RR194 pKa = 11.84CTLHH198 pKa = 7.36ASFISAEE205 pKa = 4.12GKK207 pKa = 10.25VYY209 pKa = 10.23PVDD212 pKa = 4.17PGLPVAAAGNRR223 pKa = 11.84LLVPGRR229 pKa = 11.84PTIDD233 pKa = 3.26YY234 pKa = 10.46AVAYY238 pKa = 8.79GSKK241 pKa = 10.62VNLVRR246 pKa = 11.84LGAAEE251 pKa = 3.88VWEE254 pKa = 4.33PP255 pKa = 3.68
Molecular weight: 28.63 kDa
Isoelectric point according different methods:
Protein with the highest isoelectric point:
>tr|Q9YIT7|Q9YIT7_EAV M OS=Equine arteritis virus OX=11047 GN=M PE=4 SV=1
MM1 pKa = 7.69ASRR4 pKa = 11.84RR5 pKa = 11.84SRR7 pKa = 11.84PQAASFRR14 pKa = 11.84NGRR17 pKa = 11.84RR18 pKa = 11.84RR19 pKa = 11.84QPTSYY24 pKa = 11.32NDD26 pKa = 3.83LLRR29 pKa = 11.84MFGQMRR35 pKa = 11.84VRR37 pKa = 11.84KK38 pKa = 8.9PPAQPTQAIIAEE50 pKa = 4.55PGDD53 pKa = 3.77LRR55 pKa = 11.84HH56 pKa = 7.07DD57 pKa = 4.45LNQQEE62 pKa = 4.38RR63 pKa = 11.84ATLSSNVQRR72 pKa = 11.84FFMIGHH78 pKa = 7.04GSLTADD84 pKa = 3.69AGGLTYY90 pKa = 10.09TVSWVPTKK98 pKa = 10.52QIQRR102 pKa = 11.84KK103 pKa = 6.34VAPPAGPP110 pKa = 3.29
MM1 pKa = 7.69ASRR4 pKa = 11.84RR5 pKa = 11.84SRR7 pKa = 11.84PQAASFRR14 pKa = 11.84NGRR17 pKa = 11.84RR18 pKa = 11.84RR19 pKa = 11.84QPTSYY24 pKa = 11.32NDD26 pKa = 3.83LLRR29 pKa = 11.84MFGQMRR35 pKa = 11.84VRR37 pKa = 11.84KK38 pKa = 8.9PPAQPTQAIIAEE50 pKa = 4.55PGDD53 pKa = 3.77LRR55 pKa = 11.84HH56 pKa = 7.07DD57 pKa = 4.45LNQQEE62 pKa = 4.38RR63 pKa = 11.84ATLSSNVQRR72 pKa = 11.84FFMIGHH78 pKa = 7.04GSLTADD84 pKa = 3.69AGGLTYY90 pKa = 10.09TVSWVPTKK98 pKa = 10.52QIQRR102 pKa = 11.84KK103 pKa = 6.34VAPPAGPP110 pKa = 3.29
Molecular weight: 12.3 kDa
Isoelectric point according different methods:
Peptides (in silico digests for buttom-up proteomics)
Below you can find in silico digests of the whole proteome with Trypsin, Chymotrypsin, Trypsin+LysC, LysN, ArgC proteases suitable for different mass spec machines.| Try ESI |
 |
|---|
| ChTry ESI |
 |
|---|
| ArgC ESI |
 |
|---|
| LysN ESI |
 |
|---|
| TryLysC ESI |
 |
|---|
| Try MALDI |
 |
|---|
| ChTry MALDI |
 |
|---|
| ArgC MALDI |
 |
|---|
| LysN MALDI |
 |
|---|
| TryLysC MALDI |
 |
|---|
| Try LTQ |
 |
|---|
| ChTry LTQ |
 |
|---|
| ArgC LTQ |
 |
|---|
| LysN LTQ |
 |
|---|
| TryLysC LTQ |
 |
|---|
| Try MSlow |
 |
|---|
| ChTry MSlow |
 |
|---|
| ArgC MSlow |
 |
|---|
| LysN MSlow |
 |
|---|
| TryLysC MSlow |
 |
|---|
| Try MShigh |
 |
|---|
| ChTry MShigh |
 |
|---|
| ArgC MShigh |
 |
|---|
| LysN MShigh |
 |
|---|
| TryLysC MShigh |
 |
|---|
General Statistics
Number of major isoforms |
Number of additional isoforms |
Number of all proteins |
Number of amino acids |
Min. Seq. Length |
Max. Seq. Length |
Avg. Seq. Length |
Avg. Mol. Weight |
|---|---|---|---|---|---|---|---|
0 |
6038 |
67 |
3175 |
670.9 |
73.23 |
Amino acid frequency
Ala |
Cys |
Asp |
Glu |
Phe |
Gly |
His |
Ile |
Lys |
Leu |
|---|---|---|---|---|---|---|---|---|---|
9.556 ± 0.244 | 3.362 ± 0.272 |
4.588 ± 0.519 | 3.213 ± 0.445 |
4.472 ± 0.668 | 7.486 ± 0.524 |
2.252 ± 0.393 | 3.76 ± 0.564 |
3.511 ± 0.675 | 11.047 ± 0.818 |
Met |
Asn |
Gln |
Pro |
Arg |
Ser |
Thr |
Val |
Trp |
Tyr |
|---|---|---|---|---|---|---|---|---|---|
1.888 ± 0.297 | 2.799 ± 0.176 |
5.879 ± 0.37 | 2.965 ± 0.28 |
5.383 ± 0.365 | 7.204 ± 0.495 |
6.26 ± 0.245 | 9.026 ± 0.455 |
1.656 ± 0.148 | 3.693 ± 0.45 |
Most of the basic statistics you can see at this page can be downloaded from this CSV file
Proteome-pI is available under Creative Commons Attribution-NoDerivs license, for more details see here
| Reference: Kozlowski LP. Proteome-pI 2.0: Proteome Isoelectric Point Database Update. Nucleic Acids Res. 2021, doi: 10.1093/nar/gkab944 | Contact: Lukasz P. Kozlowski |
