Acanthocystis turfacea chlorella virus 1
Taxonomy: Viruses; Varidnaviria; Bamfordvirae; Nucleocytoviricota; Megaviricetes; Algavirales; Phycodnaviridae; Chlorovirus
Average proteome isoelectric point is 7.73
Get precalculated fractions of proteins

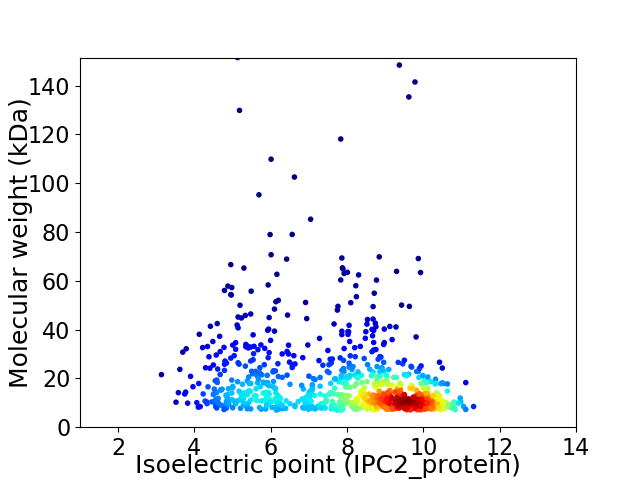
Virtual 2D-PAGE plot for 860 proteins (isoelectric point calculated using IPC2_protein)
Get csv file with sequences according to given criteria:
* You can choose from 21 different methods for calculating isoelectric point
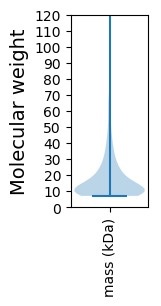
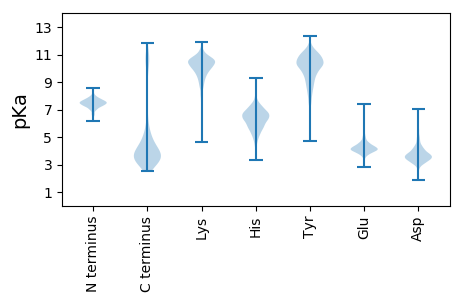
Summary statistics related to proteome-wise predictions


Protein with the lowest isoelectric point:
>tr|A7K9U2|A7K9U2_9PHYC Uncharacterized protein z682R OS=Acanthocystis turfacea chlorella virus 1 OX=322019 GN=z682R PE=4 SV=1
MM1 pKa = 7.97PLQKK5 pKa = 10.21VIRR8 pKa = 11.84IIRR11 pKa = 11.84EE12 pKa = 3.47NWVFIAIVVVVVFALAMMMRR32 pKa = 11.84KK33 pKa = 8.55EE34 pKa = 4.42RR35 pKa = 11.84YY36 pKa = 8.39MEE38 pKa = 4.59GCSLCTPGDD47 pKa = 3.61AGVLPGSVFTMSQIMNLDD65 pKa = 3.71KK66 pKa = 10.96EE67 pKa = 4.72LEE69 pKa = 4.24GCKK72 pKa = 10.22LCSLGDD78 pKa = 3.67AGVLPGSVFTMKK90 pKa = 10.51QIMDD94 pKa = 4.39LDD96 pKa = 4.21KK97 pKa = 10.79EE98 pKa = 4.33TDD100 pKa = 3.67DD101 pKa = 5.01FDD103 pKa = 4.88EE104 pKa = 4.68EE105 pKa = 4.36LAGCSTCDD113 pKa = 3.75AGDD116 pKa = 3.62AGILLDD122 pKa = 4.39TEE124 pKa = 4.64TTPEE128 pKa = 3.78TEE130 pKa = 4.45MYY132 pKa = 11.1NMPDD136 pKa = 3.23EE137 pKa = 4.88YY138 pKa = 11.02YY139 pKa = 10.95GSDD142 pKa = 3.26VKK144 pKa = 11.29VADD147 pKa = 4.85TIAEE151 pKa = 4.17VAANPSEE158 pKa = 3.87IAAVVEE164 pKa = 4.31DD165 pKa = 4.53RR166 pKa = 11.84EE167 pKa = 4.2EE168 pKa = 4.93DD169 pKa = 3.79DD170 pKa = 3.97EE171 pKa = 4.39PMYY174 pKa = 7.46MTPLEE179 pKa = 4.1YY180 pKa = 10.56QNTVEE185 pKa = 4.96QEE187 pKa = 4.01LDD189 pKa = 3.56YY190 pKa = 10.35MSPMQFQDD198 pKa = 3.19NLAQAIYY205 pKa = 10.25NATVDD210 pKa = 3.88KK211 pKa = 10.59PYY213 pKa = 11.01VDD215 pKa = 5.44NEE217 pKa = 4.17DD218 pKa = 3.91ADD220 pKa = 4.33LMSIDD225 pKa = 4.97PIDD228 pKa = 3.6YY229 pKa = 8.87TLQSDD234 pKa = 3.88AQLVNDD240 pKa = 5.25FYY242 pKa = 11.83GDD244 pKa = 3.88DD245 pKa = 3.95EE246 pKa = 4.97IDD248 pKa = 3.44YY249 pKa = 10.92KK250 pKa = 10.88EE251 pKa = 4.36RR252 pKa = 11.84EE253 pKa = 3.93RR254 pKa = 11.84IAAVKK259 pKa = 10.09ALPIDD264 pKa = 4.79FYY266 pKa = 11.14MSDD269 pKa = 3.07SSFTLLL275 pKa = 4.43
MM1 pKa = 7.97PLQKK5 pKa = 10.21VIRR8 pKa = 11.84IIRR11 pKa = 11.84EE12 pKa = 3.47NWVFIAIVVVVVFALAMMMRR32 pKa = 11.84KK33 pKa = 8.55EE34 pKa = 4.42RR35 pKa = 11.84YY36 pKa = 8.39MEE38 pKa = 4.59GCSLCTPGDD47 pKa = 3.61AGVLPGSVFTMSQIMNLDD65 pKa = 3.71KK66 pKa = 10.96EE67 pKa = 4.72LEE69 pKa = 4.24GCKK72 pKa = 10.22LCSLGDD78 pKa = 3.67AGVLPGSVFTMKK90 pKa = 10.51QIMDD94 pKa = 4.39LDD96 pKa = 4.21KK97 pKa = 10.79EE98 pKa = 4.33TDD100 pKa = 3.67DD101 pKa = 5.01FDD103 pKa = 4.88EE104 pKa = 4.68EE105 pKa = 4.36LAGCSTCDD113 pKa = 3.75AGDD116 pKa = 3.62AGILLDD122 pKa = 4.39TEE124 pKa = 4.64TTPEE128 pKa = 3.78TEE130 pKa = 4.45MYY132 pKa = 11.1NMPDD136 pKa = 3.23EE137 pKa = 4.88YY138 pKa = 11.02YY139 pKa = 10.95GSDD142 pKa = 3.26VKK144 pKa = 11.29VADD147 pKa = 4.85TIAEE151 pKa = 4.17VAANPSEE158 pKa = 3.87IAAVVEE164 pKa = 4.31DD165 pKa = 4.53RR166 pKa = 11.84EE167 pKa = 4.2EE168 pKa = 4.93DD169 pKa = 3.79DD170 pKa = 3.97EE171 pKa = 4.39PMYY174 pKa = 7.46MTPLEE179 pKa = 4.1YY180 pKa = 10.56QNTVEE185 pKa = 4.96QEE187 pKa = 4.01LDD189 pKa = 3.56YY190 pKa = 10.35MSPMQFQDD198 pKa = 3.19NLAQAIYY205 pKa = 10.25NATVDD210 pKa = 3.88KK211 pKa = 10.59PYY213 pKa = 11.01VDD215 pKa = 5.44NEE217 pKa = 4.17DD218 pKa = 3.91ADD220 pKa = 4.33LMSIDD225 pKa = 4.97PIDD228 pKa = 3.6YY229 pKa = 8.87TLQSDD234 pKa = 3.88AQLVNDD240 pKa = 5.25FYY242 pKa = 11.83GDD244 pKa = 3.88DD245 pKa = 3.95EE246 pKa = 4.97IDD248 pKa = 3.44YY249 pKa = 10.92KK250 pKa = 10.88EE251 pKa = 4.36RR252 pKa = 11.84EE253 pKa = 3.93RR254 pKa = 11.84IAAVKK259 pKa = 10.09ALPIDD264 pKa = 4.79FYY266 pKa = 11.14MSDD269 pKa = 3.07SSFTLLL275 pKa = 4.43
Molecular weight: 30.78 kDa
Isoelectric point according different methods:
Protein with the highest isoelectric point:
>tr|A7K916|A7K916_9PHYC Uncharacterized protein z406R OS=Acanthocystis turfacea chlorella virus 1 OX=322019 GN=z406R PE=4 SV=1
MM1 pKa = 7.61LLLLPLQTFSHH12 pKa = 6.87RR13 pKa = 11.84KK14 pKa = 7.98PLQPLPPRR22 pKa = 11.84TFSHH26 pKa = 6.56RR27 pKa = 11.84HH28 pKa = 5.02PLLPLLLTRR37 pKa = 11.84FRR39 pKa = 11.84KK40 pKa = 7.75TRR42 pKa = 11.84QANLQQAFFRR52 pKa = 11.84SPRR55 pKa = 11.84PRR57 pKa = 11.84PVSRR61 pKa = 11.84RR62 pKa = 11.84SLSQRR67 pKa = 11.84HH68 pKa = 5.28HH69 pKa = 6.5RR70 pKa = 4.01
MM1 pKa = 7.61LLLLPLQTFSHH12 pKa = 6.87RR13 pKa = 11.84KK14 pKa = 7.98PLQPLPPRR22 pKa = 11.84TFSHH26 pKa = 6.56RR27 pKa = 11.84HH28 pKa = 5.02PLLPLLLTRR37 pKa = 11.84FRR39 pKa = 11.84KK40 pKa = 7.75TRR42 pKa = 11.84QANLQQAFFRR52 pKa = 11.84SPRR55 pKa = 11.84PRR57 pKa = 11.84PVSRR61 pKa = 11.84RR62 pKa = 11.84SLSQRR67 pKa = 11.84HH68 pKa = 5.28HH69 pKa = 6.5RR70 pKa = 4.01
Molecular weight: 8.46 kDa
Isoelectric point according different methods:
Peptides (in silico digests for buttom-up proteomics)
Below you can find in silico digests of the whole proteome with Trypsin, Chymotrypsin, Trypsin+LysC, LysN, ArgC proteases suitable for different mass spec machines.| Try ESI |
 |
|---|
| ChTry ESI |
 |
|---|
| ArgC ESI |
 |
|---|
| LysN ESI |
 |
|---|
| TryLysC ESI |
 |
|---|
| Try MALDI |
 |
|---|
| ChTry MALDI |
 |
|---|
| ArgC MALDI |
 |
|---|
| LysN MALDI |
 |
|---|
| TryLysC MALDI |
 |
|---|
| Try LTQ |
 |
|---|
| ChTry LTQ |
 |
|---|
| ArgC LTQ |
 |
|---|
| LysN LTQ |
 |
|---|
| TryLysC LTQ |
 |
|---|
| Try MSlow |
 |
|---|
| ChTry MSlow |
 |
|---|
| ArgC MSlow |
 |
|---|
| LysN MSlow |
 |
|---|
| TryLysC MSlow |
 |
|---|
| Try MShigh |
 |
|---|
| ChTry MShigh |
 |
|---|
| ArgC MShigh |
 |
|---|
| LysN MShigh |
 |
|---|
| TryLysC MShigh |
 |
|---|
General Statistics
Number of major isoforms |
Number of additional isoforms |
Number of all proteins |
Number of amino acids |
Min. Seq. Length |
Max. Seq. Length |
Avg. Seq. Length |
Avg. Mol. Weight |
|---|---|---|---|---|---|---|---|
0 |
145517 |
65 |
1450 |
169.2 |
18.88 |
Amino acid frequency
Ala |
Cys |
Asp |
Glu |
Phe |
Gly |
His |
Ile |
Lys |
Leu |
|---|---|---|---|---|---|---|---|---|---|
7.379 ± 0.105 | 2.145 ± 0.07 |
4.738 ± 0.1 | 4.665 ± 0.12 |
4.753 ± 0.097 | 6.436 ± 0.179 |
2.464 ± 0.087 | 5.379 ± 0.086 |
5.624 ± 0.157 | 8.334 ± 0.143 |
Met |
Asn |
Gln |
Pro |
Arg |
Ser |
Thr |
Val |
Trp |
Tyr |
|---|---|---|---|---|---|---|---|---|---|
2.91 ± 0.072 | 4.26 ± 0.136 |
5.378 ± 0.137 | 2.954 ± 0.084 |
6.287 ± 0.146 | 8.077 ± 0.156 |
6.361 ± 0.113 | 7.523 ± 0.126 |
1.277 ± 0.048 | 3.055 ± 0.065 |
Most of the basic statistics you can see at this page can be downloaded from this CSV file
Proteome-pI is available under Creative Commons Attribution-NoDerivs license, for more details see here
| Reference: Kozlowski LP. Proteome-pI 2.0: Proteome Isoelectric Point Database Update. Nucleic Acids Res. 2021, doi: 10.1093/nar/gkab944 | Contact: Lukasz P. Kozlowski |
