Rhodobacter sp. ETT8
Taxonomy: cellular organisms; Bacteria; Proteobacteria; Alphaproteobacteria; Rhodobacterales; Rhodobacteraceae; Rhodobacter; unclassified Rhodobacter
Average proteome isoelectric point is 6.49
Get precalculated fractions of proteins

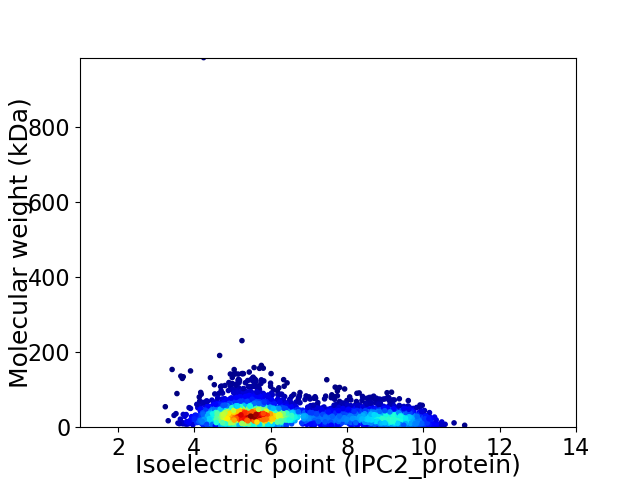
Virtual 2D-PAGE plot for 4261 proteins (isoelectric point calculated using IPC2_protein)
Get csv file with sequences according to given criteria:
* You can choose from 21 different methods for calculating isoelectric point
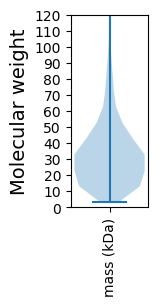
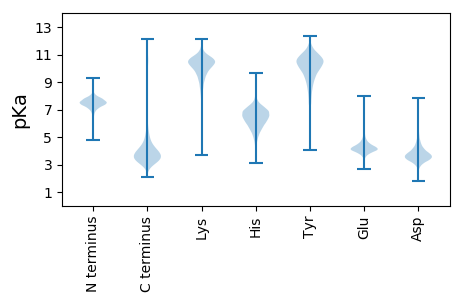
Summary statistics related to proteome-wise predictions


Protein with the lowest isoelectric point:
>tr|A0A6B3RZ10|A0A6B3RZ10_9RHOB Uncharacterized protein OS=Rhodobacter sp. ETT8 OX=2709381 GN=G3572_19455 PE=4 SV=1
MM1 pKa = 7.69LGGLVALPVAVSAHH15 pKa = 4.73PHH17 pKa = 4.76VFIDD21 pKa = 3.44ATIEE25 pKa = 4.19VIFDD29 pKa = 3.36AEE31 pKa = 4.11GRR33 pKa = 11.84AEE35 pKa = 3.97ALRR38 pKa = 11.84IGWRR42 pKa = 11.84YY43 pKa = 10.84DD44 pKa = 3.09SLFSMTYY51 pKa = 9.9VAEE54 pKa = 4.03QGYY57 pKa = 10.44DD58 pKa = 3.41PDD60 pKa = 4.28FDD62 pKa = 3.98GVLTAEE68 pKa = 4.57EE69 pKa = 4.06EE70 pKa = 3.97AALAGFDD77 pKa = 4.0MGWHH81 pKa = 6.65EE82 pKa = 5.6DD83 pKa = 3.89FAGDD87 pKa = 3.93TYY89 pKa = 11.92ALLGEE94 pKa = 4.75APLALSGPLEE104 pKa = 4.04PTAAYY109 pKa = 10.65VDD111 pKa = 3.68GSLRR115 pKa = 11.84STHH118 pKa = 5.9LRR120 pKa = 11.84RR121 pKa = 11.84LAAPVALGAEE131 pKa = 4.18EE132 pKa = 5.57LVVQVYY138 pKa = 10.43DD139 pKa = 3.6PSFYY143 pKa = 10.34TSYY146 pKa = 11.11LIAEE150 pKa = 4.58TPVLTGGEE158 pKa = 4.29GCRR161 pKa = 11.84VQVYY165 pKa = 9.94EE166 pKa = 4.58PDD168 pKa = 3.62RR169 pKa = 11.84EE170 pKa = 4.17AADD173 pKa = 3.7ARR175 pKa = 11.84LQAALDD181 pKa = 4.03EE182 pKa = 4.76LAGSADD188 pKa = 3.73AEE190 pKa = 4.71SEE192 pKa = 4.4FPAIGAAYY200 pKa = 9.98AEE202 pKa = 4.6EE203 pKa = 4.26ARR205 pKa = 11.84ISCGGEE211 pKa = 3.53
MM1 pKa = 7.69LGGLVALPVAVSAHH15 pKa = 4.73PHH17 pKa = 4.76VFIDD21 pKa = 3.44ATIEE25 pKa = 4.19VIFDD29 pKa = 3.36AEE31 pKa = 4.11GRR33 pKa = 11.84AEE35 pKa = 3.97ALRR38 pKa = 11.84IGWRR42 pKa = 11.84YY43 pKa = 10.84DD44 pKa = 3.09SLFSMTYY51 pKa = 9.9VAEE54 pKa = 4.03QGYY57 pKa = 10.44DD58 pKa = 3.41PDD60 pKa = 4.28FDD62 pKa = 3.98GVLTAEE68 pKa = 4.57EE69 pKa = 4.06EE70 pKa = 3.97AALAGFDD77 pKa = 4.0MGWHH81 pKa = 6.65EE82 pKa = 5.6DD83 pKa = 3.89FAGDD87 pKa = 3.93TYY89 pKa = 11.92ALLGEE94 pKa = 4.75APLALSGPLEE104 pKa = 4.04PTAAYY109 pKa = 10.65VDD111 pKa = 3.68GSLRR115 pKa = 11.84STHH118 pKa = 5.9LRR120 pKa = 11.84RR121 pKa = 11.84LAAPVALGAEE131 pKa = 4.18EE132 pKa = 5.57LVVQVYY138 pKa = 10.43DD139 pKa = 3.6PSFYY143 pKa = 10.34TSYY146 pKa = 11.11LIAEE150 pKa = 4.58TPVLTGGEE158 pKa = 4.29GCRR161 pKa = 11.84VQVYY165 pKa = 9.94EE166 pKa = 4.58PDD168 pKa = 3.62RR169 pKa = 11.84EE170 pKa = 4.17AADD173 pKa = 3.7ARR175 pKa = 11.84LQAALDD181 pKa = 4.03EE182 pKa = 4.76LAGSADD188 pKa = 3.73AEE190 pKa = 4.71SEE192 pKa = 4.4FPAIGAAYY200 pKa = 9.98AEE202 pKa = 4.6EE203 pKa = 4.26ARR205 pKa = 11.84ISCGGEE211 pKa = 3.53
Molecular weight: 22.39 kDa
Isoelectric point according different methods:
Protein with the highest isoelectric point:
>tr|A0A6B3RLJ2|A0A6B3RLJ2_9RHOB DNA helicase OS=Rhodobacter sp. ETT8 OX=2709381 GN=recQ PE=3 SV=1
MM1 pKa = 7.35KK2 pKa = 9.44RR3 pKa = 11.84TYY5 pKa = 10.31QPSNLVRR12 pKa = 11.84KK13 pKa = 9.18RR14 pKa = 11.84RR15 pKa = 11.84HH16 pKa = 4.42GFRR19 pKa = 11.84ARR21 pKa = 11.84MATKK25 pKa = 10.34GGRR28 pKa = 11.84LVLAARR34 pKa = 11.84RR35 pKa = 11.84AKK37 pKa = 10.21GRR39 pKa = 11.84HH40 pKa = 5.51KK41 pKa = 10.9LSAA44 pKa = 3.8
MM1 pKa = 7.35KK2 pKa = 9.44RR3 pKa = 11.84TYY5 pKa = 10.31QPSNLVRR12 pKa = 11.84KK13 pKa = 9.18RR14 pKa = 11.84RR15 pKa = 11.84HH16 pKa = 4.42GFRR19 pKa = 11.84ARR21 pKa = 11.84MATKK25 pKa = 10.34GGRR28 pKa = 11.84LVLAARR34 pKa = 11.84RR35 pKa = 11.84AKK37 pKa = 10.21GRR39 pKa = 11.84HH40 pKa = 5.51KK41 pKa = 10.9LSAA44 pKa = 3.8
Molecular weight: 5.09 kDa
Isoelectric point according different methods:
Peptides (in silico digests for buttom-up proteomics)
Below you can find in silico digests of the whole proteome with Trypsin, Chymotrypsin, Trypsin+LysC, LysN, ArgC proteases suitable for different mass spec machines.| Try ESI |
 |
|---|
| ChTry ESI |
 |
|---|
| ArgC ESI |
 |
|---|
| LysN ESI |
 |
|---|
| TryLysC ESI |
 |
|---|
| Try MALDI |
 |
|---|
| ChTry MALDI |
 |
|---|
| ArgC MALDI |
 |
|---|
| LysN MALDI |
 |
|---|
| TryLysC MALDI |
 |
|---|
| Try LTQ |
 |
|---|
| ChTry LTQ |
 |
|---|
| ArgC LTQ |
 |
|---|
| LysN LTQ |
 |
|---|
| TryLysC LTQ |
 |
|---|
| Try MSlow |
 |
|---|
| ChTry MSlow |
 |
|---|
| ArgC MSlow |
 |
|---|
| LysN MSlow |
 |
|---|
| TryLysC MSlow |
 |
|---|
| Try MShigh |
 |
|---|
| ChTry MShigh |
 |
|---|
| ArgC MShigh |
 |
|---|
| LysN MShigh |
 |
|---|
| TryLysC MShigh |
 |
|---|
General Statistics
Number of major isoforms |
Number of additional isoforms |
Number of all proteins |
Number of amino acids |
Min. Seq. Length |
Max. Seq. Length |
Avg. Seq. Length |
Avg. Mol. Weight |
|---|---|---|---|---|---|---|---|
0 |
1351082 |
31 |
9718 |
317.1 |
34.21 |
Amino acid frequency
Ala |
Cys |
Asp |
Glu |
Phe |
Gly |
His |
Ile |
Lys |
Leu |
|---|---|---|---|---|---|---|---|---|---|
13.517 ± 0.061 | 0.847 ± 0.013 |
5.667 ± 0.034 | 5.471 ± 0.035 |
3.596 ± 0.022 | 8.874 ± 0.048 |
2.022 ± 0.019 | 4.837 ± 0.027 |
2.717 ± 0.035 | 10.379 ± 0.056 |
Met |
Asn |
Gln |
Pro |
Arg |
Ser |
Thr |
Val |
Trp |
Tyr |
|---|---|---|---|---|---|---|---|---|---|
2.678 ± 0.024 | 2.358 ± 0.03 |
5.361 ± 0.033 | 3.225 ± 0.02 |
7.193 ± 0.045 | 4.953 ± 0.032 |
5.417 ± 0.042 | 7.41 ± 0.037 |
1.467 ± 0.018 | 2.011 ± 0.018 |
Most of the basic statistics you can see at this page can be downloaded from this CSV file
Proteome-pI is available under Creative Commons Attribution-NoDerivs license, for more details see here
| Reference: Kozlowski LP. Proteome-pI 2.0: Proteome Isoelectric Point Database Update. Nucleic Acids Res. 2021, doi: 10.1093/nar/gkab944 | Contact: Lukasz P. Kozlowski |
