Bovine adenovirus B serotype 3 (BAdV-3) (Mastadenovirus bos3)
Taxonomy: Viruses; Varidnaviria; Bamfordvirae; Preplasmiviricota; Tectiliviricetes; Rowavirales; Adenoviridae; Mastadenovirus; Bovine mastadenovirus B
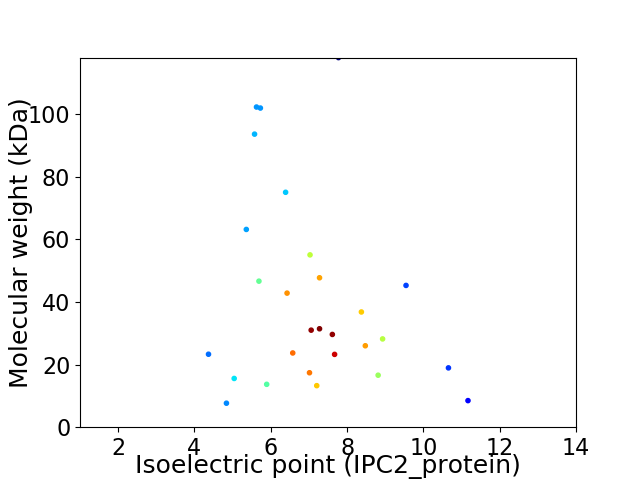
Average proteome isoelectric point is 7.02
Get precalculated fractions of proteins

Virtual 2D-PAGE plot for 28 proteins (isoelectric point calculated using IPC2_protein)
Get csv file with sequences according to given criteria:
* You can choose from 21 different methods for calculating isoelectric point
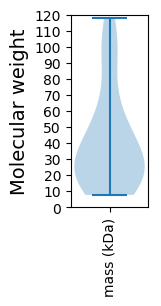
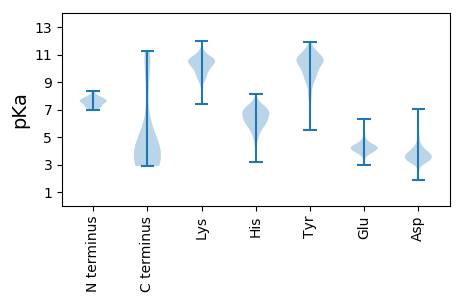
Summary statistics related to proteome-wise predictions


Protein with the lowest isoelectric point:
>tr|Q64844|Q64844_ADEB3 E1B 55 kDa protein OS=Bovine adenovirus B serotype 3 OX=10510 GN=E1B PE=3 SV=1
MM1 pKa = 7.74KK2 pKa = 10.71YY3 pKa = 10.36LVLVLNDD10 pKa = 3.04GMSRR14 pKa = 11.84IEE16 pKa = 4.26KK17 pKa = 10.54ALLCSDD23 pKa = 4.1GEE25 pKa = 4.28VDD27 pKa = 4.85LEE29 pKa = 4.28CHH31 pKa = 5.66EE32 pKa = 4.63VLPPSPAPVPASVSPVRR49 pKa = 11.84SPPPLSPVFPPSPPAPLVNPEE70 pKa = 4.23ASSLLQQYY78 pKa = 9.58RR79 pKa = 11.84RR80 pKa = 11.84EE81 pKa = 3.96LLEE84 pKa = 4.36RR85 pKa = 11.84SLLRR89 pKa = 11.84TAEE92 pKa = 4.09GQQRR96 pKa = 11.84AVCPCEE102 pKa = 3.68RR103 pKa = 11.84LPVEE107 pKa = 4.71EE108 pKa = 5.3DD109 pKa = 3.01EE110 pKa = 5.32CLNAVNLLFPDD121 pKa = 3.61PWLNAAEE128 pKa = 4.14NGGDD132 pKa = 3.43IFKK135 pKa = 10.73SPAMSPEE142 pKa = 3.52PWIDD146 pKa = 3.35LSSYY150 pKa = 11.05DD151 pKa = 3.61SDD153 pKa = 4.09VEE155 pKa = 4.25EE156 pKa = 4.49VTSHH160 pKa = 7.13FFLDD164 pKa = 4.22CPEE167 pKa = 4.49DD168 pKa = 3.75PSRR171 pKa = 11.84EE172 pKa = 3.94CSSCGFHH179 pKa = 5.98QAQSGIPGIMCSLCYY194 pKa = 9.77MRR196 pKa = 11.84QTYY199 pKa = 9.1HH200 pKa = 7.14CIYY203 pKa = 10.35SPVSEE208 pKa = 4.51EE209 pKa = 3.93EE210 pKa = 3.93MM211 pKa = 4.33
MM1 pKa = 7.74KK2 pKa = 10.71YY3 pKa = 10.36LVLVLNDD10 pKa = 3.04GMSRR14 pKa = 11.84IEE16 pKa = 4.26KK17 pKa = 10.54ALLCSDD23 pKa = 4.1GEE25 pKa = 4.28VDD27 pKa = 4.85LEE29 pKa = 4.28CHH31 pKa = 5.66EE32 pKa = 4.63VLPPSPAPVPASVSPVRR49 pKa = 11.84SPPPLSPVFPPSPPAPLVNPEE70 pKa = 4.23ASSLLQQYY78 pKa = 9.58RR79 pKa = 11.84RR80 pKa = 11.84EE81 pKa = 3.96LLEE84 pKa = 4.36RR85 pKa = 11.84SLLRR89 pKa = 11.84TAEE92 pKa = 4.09GQQRR96 pKa = 11.84AVCPCEE102 pKa = 3.68RR103 pKa = 11.84LPVEE107 pKa = 4.71EE108 pKa = 5.3DD109 pKa = 3.01EE110 pKa = 5.32CLNAVNLLFPDD121 pKa = 3.61PWLNAAEE128 pKa = 4.14NGGDD132 pKa = 3.43IFKK135 pKa = 10.73SPAMSPEE142 pKa = 3.52PWIDD146 pKa = 3.35LSSYY150 pKa = 11.05DD151 pKa = 3.61SDD153 pKa = 4.09VEE155 pKa = 4.25EE156 pKa = 4.49VTSHH160 pKa = 7.13FFLDD164 pKa = 4.22CPEE167 pKa = 4.49DD168 pKa = 3.75PSRR171 pKa = 11.84EE172 pKa = 3.94CSSCGFHH179 pKa = 5.98QAQSGIPGIMCSLCYY194 pKa = 9.77MRR196 pKa = 11.84QTYY199 pKa = 9.1HH200 pKa = 7.14CIYY203 pKa = 10.35SPVSEE208 pKa = 4.51EE209 pKa = 3.93EE210 pKa = 3.93MM211 pKa = 4.33
Molecular weight: 23.32 kDa
Isoelectric point according different methods:
Protein with the highest isoelectric point:
>tr|O71100|O71100_ADEB3 PVI OS=Bovine adenovirus B serotype 3 OX=10510 PE=4 SV=1
MM1 pKa = 7.59SPRR4 pKa = 11.84GNLTYY9 pKa = 10.85RR10 pKa = 11.84LRR12 pKa = 11.84IPVALSGRR20 pKa = 11.84RR21 pKa = 11.84RR22 pKa = 11.84RR23 pKa = 11.84RR24 pKa = 11.84TGLRR28 pKa = 11.84GGSAYY33 pKa = 11.06LLGRR37 pKa = 11.84RR38 pKa = 11.84RR39 pKa = 11.84RR40 pKa = 11.84RR41 pKa = 11.84AGGGRR46 pKa = 11.84LRR48 pKa = 11.84GGFLPLLAPIIAAAIGAIPGIASVAIQAAHH78 pKa = 6.14NKK80 pKa = 9.21
MM1 pKa = 7.59SPRR4 pKa = 11.84GNLTYY9 pKa = 10.85RR10 pKa = 11.84LRR12 pKa = 11.84IPVALSGRR20 pKa = 11.84RR21 pKa = 11.84RR22 pKa = 11.84RR23 pKa = 11.84RR24 pKa = 11.84TGLRR28 pKa = 11.84GGSAYY33 pKa = 11.06LLGRR37 pKa = 11.84RR38 pKa = 11.84RR39 pKa = 11.84RR40 pKa = 11.84RR41 pKa = 11.84AGGGRR46 pKa = 11.84LRR48 pKa = 11.84GGFLPLLAPIIAAAIGAIPGIASVAIQAAHH78 pKa = 6.14NKK80 pKa = 9.21
Molecular weight: 8.5 kDa
Isoelectric point according different methods:
Peptides (in silico digests for buttom-up proteomics)
Below you can find in silico digests of the whole proteome with Trypsin, Chymotrypsin, Trypsin+LysC, LysN, ArgC proteases suitable for different mass spec machines.| Try ESI |
 |
|---|
| ChTry ESI |
 |
|---|
| ArgC ESI |
 |
|---|
| LysN ESI |
 |
|---|
| TryLysC ESI |
 |
|---|
| Try MALDI |
 |
|---|
| ChTry MALDI |
 |
|---|
| ArgC MALDI |
 |
|---|
| LysN MALDI |
 |
|---|
| TryLysC MALDI |
 |
|---|
| Try LTQ |
 |
|---|
| ChTry LTQ |
 |
|---|
| ArgC LTQ |
 |
|---|
| LysN LTQ |
 |
|---|
| TryLysC LTQ |
 |
|---|
| Try MSlow |
 |
|---|
| ChTry MSlow |
 |
|---|
| ArgC MSlow |
 |
|---|
| LysN MSlow |
 |
|---|
| TryLysC MSlow |
 |
|---|
| Try MShigh |
 |
|---|
| ChTry MShigh |
 |
|---|
| ArgC MShigh |
 |
|---|
| LysN MShigh |
 |
|---|
| TryLysC MShigh |
 |
|---|
General Statistics
Number of major isoforms |
Number of additional isoforms |
Number of all proteins |
Number of amino acids |
Min. Seq. Length |
Max. Seq. Length |
Avg. Seq. Length |
Avg. Mol. Weight |
|---|---|---|---|---|---|---|---|
10367 |
69 |
1023 |
370.3 |
41.33 |
Amino acid frequency
Ala |
Cys |
Asp |
Glu |
Phe |
Gly |
His |
Ile |
Lys |
Leu |
|---|---|---|---|---|---|---|---|---|---|
8.228 ± 0.497 | 1.939 ± 0.424 |
4.688 ± 0.207 | 5.46 ± 0.469 |
4.138 ± 0.331 | 6.357 ± 0.641 |
2.45 ± 0.166 | 3.887 ± 0.244 |
3.482 ± 0.358 | 9.916 ± 0.497 |
Met |
Asn |
Gln |
Pro |
Arg |
Ser |
Thr |
Val |
Trp |
Tyr |
|---|---|---|---|---|---|---|---|---|---|
2.122 ± 0.23 | 4.466 ± 0.499 |
6.945 ± 0.411 | 4.514 ± 0.23 |
7.254 ± 0.674 | 7.263 ± 0.35 |
5.865 ± 0.35 | 6.472 ± 0.408 |
1.254 ± 0.135 | 3.299 ± 0.362 |
Most of the basic statistics you can see at this page can be downloaded from this CSV file
Proteome-pI is available under Creative Commons Attribution-NoDerivs license, for more details see here
| Reference: Kozlowski LP. Proteome-pI 2.0: Proteome Isoelectric Point Database Update. Nucleic Acids Res. 2021, doi: 10.1093/nar/gkab944 | Contact: Lukasz P. Kozlowski |
