Ureaplasma parvum serovar 3 (strain ATCC 700970)
Taxonomy: cellular organisms; Bacteria; Terrabacteria group; Tenericutes; Mollicutes; Mycoplasmatales; Mycoplasmataceae; Ureaplasma; Ureaplasma parvum; Ureaplasma parvum serovar 3
Average proteome isoelectric point is 7.51
Get precalculated fractions of proteins
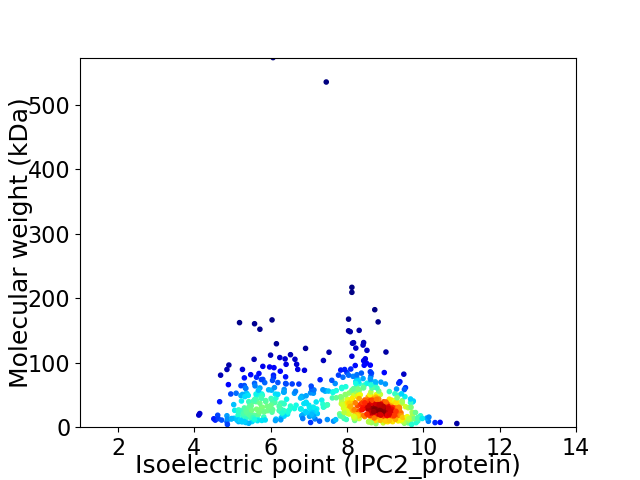
Virtual 2D-PAGE plot for 611 proteins (isoelectric point calculated using IPC2_protein)
Get csv file with sequences according to given criteria:
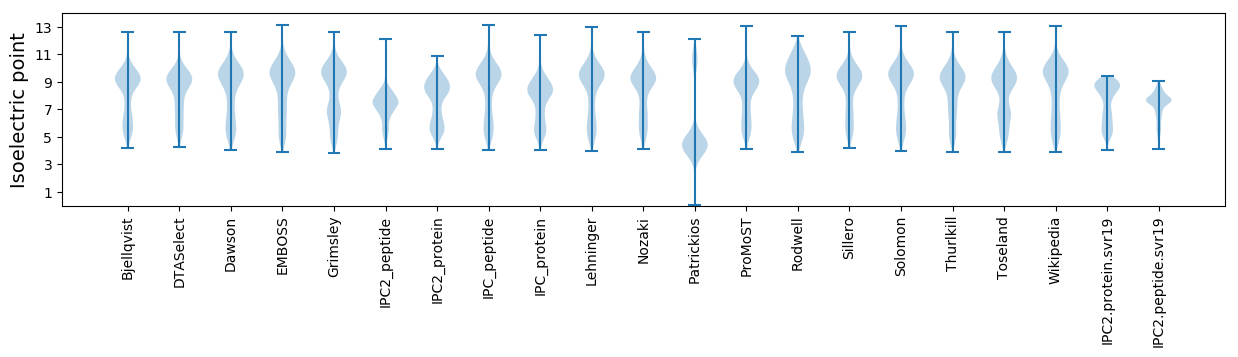
* You can choose from 21 different methods for calculating isoelectric point
Summary statistics related to proteome-wise predictions
Protein with the lowest isoelectric point:
>tr|Q9PR48|Q9PR48_UREPA Type I restriction enzyme S protein OS=Ureaplasma parvum serovar 3 (strain ATCC 700970) OX=273119 GN=hsdS-1 PE=4 SV=1
MM1 pKa = 7.64AKK3 pKa = 10.15YY4 pKa = 10.02IKK6 pKa = 9.99TGVSYY11 pKa = 11.14INLDD15 pKa = 3.29NARR18 pKa = 11.84TINILPEE25 pKa = 5.56DD26 pKa = 3.69IDD28 pKa = 4.29SYY30 pKa = 11.84LEE32 pKa = 4.02LGGDD36 pKa = 3.76EE37 pKa = 4.69AYY39 pKa = 8.02KK40 pKa = 10.68TSDD43 pKa = 4.0LGSEE47 pKa = 4.66LYY49 pKa = 10.29INYY52 pKa = 10.15ADD54 pKa = 4.33FEE56 pKa = 4.76STNILFDD63 pKa = 4.01LKK65 pKa = 10.97KK66 pKa = 10.85EE67 pKa = 3.92EE68 pKa = 4.13LQAKK72 pKa = 9.33IDD74 pKa = 3.8AFLISNDD81 pKa = 3.48TVLDD85 pKa = 3.98LSEE88 pKa = 4.41VFLDD92 pKa = 3.25IHH94 pKa = 6.73FSEE97 pKa = 5.91DD98 pKa = 3.15DD99 pKa = 4.49DD100 pKa = 5.13YY101 pKa = 12.11EE102 pKa = 4.19EE103 pKa = 5.32DD104 pKa = 3.86CCCEE108 pKa = 4.49DD109 pKa = 3.62EE110 pKa = 4.7CCSDD114 pKa = 4.15EE115 pKa = 5.16EE116 pKa = 5.79NEE118 pKa = 4.17ACCNSEE124 pKa = 3.92VKK126 pKa = 10.66VEE128 pKa = 4.11EE129 pKa = 4.47EE130 pKa = 4.46CCGGAKK136 pKa = 9.97DD137 pKa = 4.12DD138 pKa = 3.95CCGGHH143 pKa = 4.63EE144 pKa = 4.73HH145 pKa = 5.82EE146 pKa = 6.08HH147 pKa = 5.86EE148 pKa = 4.58VCCDD152 pKa = 3.44SEE154 pKa = 4.77TKK156 pKa = 10.23TSEE159 pKa = 4.18TQEE162 pKa = 4.2EE163 pKa = 5.47CCGGTKK169 pKa = 10.11DD170 pKa = 4.01DD171 pKa = 3.91CCGGHH176 pKa = 5.26EE177 pKa = 4.56HH178 pKa = 6.34EE179 pKa = 4.85HH180 pKa = 5.95HH181 pKa = 6.68HH182 pKa = 6.04HH183 pKa = 7.0HH184 pKa = 6.08SHH186 pKa = 5.1QHH188 pKa = 4.48
MM1 pKa = 7.64AKK3 pKa = 10.15YY4 pKa = 10.02IKK6 pKa = 9.99TGVSYY11 pKa = 11.14INLDD15 pKa = 3.29NARR18 pKa = 11.84TINILPEE25 pKa = 5.56DD26 pKa = 3.69IDD28 pKa = 4.29SYY30 pKa = 11.84LEE32 pKa = 4.02LGGDD36 pKa = 3.76EE37 pKa = 4.69AYY39 pKa = 8.02KK40 pKa = 10.68TSDD43 pKa = 4.0LGSEE47 pKa = 4.66LYY49 pKa = 10.29INYY52 pKa = 10.15ADD54 pKa = 4.33FEE56 pKa = 4.76STNILFDD63 pKa = 4.01LKK65 pKa = 10.97KK66 pKa = 10.85EE67 pKa = 3.92EE68 pKa = 4.13LQAKK72 pKa = 9.33IDD74 pKa = 3.8AFLISNDD81 pKa = 3.48TVLDD85 pKa = 3.98LSEE88 pKa = 4.41VFLDD92 pKa = 3.25IHH94 pKa = 6.73FSEE97 pKa = 5.91DD98 pKa = 3.15DD99 pKa = 4.49DD100 pKa = 5.13YY101 pKa = 12.11EE102 pKa = 4.19EE103 pKa = 5.32DD104 pKa = 3.86CCCEE108 pKa = 4.49DD109 pKa = 3.62EE110 pKa = 4.7CCSDD114 pKa = 4.15EE115 pKa = 5.16EE116 pKa = 5.79NEE118 pKa = 4.17ACCNSEE124 pKa = 3.92VKK126 pKa = 10.66VEE128 pKa = 4.11EE129 pKa = 4.47EE130 pKa = 4.46CCGGAKK136 pKa = 9.97DD137 pKa = 4.12DD138 pKa = 3.95CCGGHH143 pKa = 4.63EE144 pKa = 4.73HH145 pKa = 5.82EE146 pKa = 6.08HH147 pKa = 5.86EE148 pKa = 4.58VCCDD152 pKa = 3.44SEE154 pKa = 4.77TKK156 pKa = 10.23TSEE159 pKa = 4.18TQEE162 pKa = 4.2EE163 pKa = 5.47CCGGTKK169 pKa = 10.11DD170 pKa = 4.01DD171 pKa = 3.91CCGGHH176 pKa = 5.26EE177 pKa = 4.56HH178 pKa = 6.34EE179 pKa = 4.85HH180 pKa = 5.95HH181 pKa = 6.68HH182 pKa = 6.04HH183 pKa = 7.0HH184 pKa = 6.08SHH186 pKa = 5.1QHH188 pKa = 4.48
Molecular weight: 21.16 kDa
Isoelectric point according different methods:
Protein with the highest isoelectric point:
>sp|Q9PPN8|RSMA_UREPA Ribosomal RNA small subunit methyltransferase A OS=Ureaplasma parvum serovar 3 (strain ATCC 700970) OX=273119 GN=rsmA PE=3 SV=2
MM1 pKa = 7.44KK2 pKa = 9.6RR3 pKa = 11.84TFQPNNRR10 pKa = 11.84KK11 pKa = 8.78RR12 pKa = 11.84AKK14 pKa = 9.29VHH16 pKa = 5.53GFRR19 pKa = 11.84ARR21 pKa = 11.84MKK23 pKa = 9.24TKK25 pKa = 10.3NGRR28 pKa = 11.84NVLARR33 pKa = 11.84RR34 pKa = 11.84RR35 pKa = 11.84LKK37 pKa = 10.53GRR39 pKa = 11.84HH40 pKa = 5.44SLTVSSEE47 pKa = 4.0KK48 pKa = 10.94
MM1 pKa = 7.44KK2 pKa = 9.6RR3 pKa = 11.84TFQPNNRR10 pKa = 11.84KK11 pKa = 8.78RR12 pKa = 11.84AKK14 pKa = 9.29VHH16 pKa = 5.53GFRR19 pKa = 11.84ARR21 pKa = 11.84MKK23 pKa = 9.24TKK25 pKa = 10.3NGRR28 pKa = 11.84NVLARR33 pKa = 11.84RR34 pKa = 11.84RR35 pKa = 11.84LKK37 pKa = 10.53GRR39 pKa = 11.84HH40 pKa = 5.44SLTVSSEE47 pKa = 4.0KK48 pKa = 10.94
Molecular weight: 5.7 kDa
Isoelectric point according different methods:
Peptides (in silico digests for buttom-up proteomics)
Below you can find in silico digests of the whole proteome with Trypsin, Chymotrypsin, Trypsin+LysC, LysN, ArgC proteases suitable for different mass spec machines.| Try ESI |
 |
|---|
| ChTry ESI |
|
|---|
| ArgC ESI |
|
|---|
| LysN ESI |
|
|---|
| TryLysC ESI |
|
|---|
| Try MALDI |
|
|---|
| ChTry MALDI |
|
|---|
| ArgC MALDI |
|
|---|
| LysN MALDI |
|
|---|
| TryLysC MALDI |
|
|---|
| Try LTQ |
|
|---|
| ChTry LTQ |
|
|---|
| ArgC LTQ |
|
|---|
| LysN LTQ |
|
|---|
| TryLysC LTQ |
|
|---|
| Try MSlow |
|
|---|
| ChTry MSlow |
|
|---|
| ArgC MSlow |
|
|---|
| LysN MSlow |
|
|---|
| TryLysC MSlow |
|
|---|
| Try MShigh |
|
|---|
| ChTry MShigh |
|
|---|
| ArgC MShigh |
|
|---|
| LysN MShigh |
|
|---|
| TryLysC MShigh |
|
|---|
General Statistics
Number of major isoforms |
Number of additional isoforms |
Number of all proteins |
Number of amino acids |
Min. Seq. Length |
Max. Seq. Length |
Avg. Seq. Length |
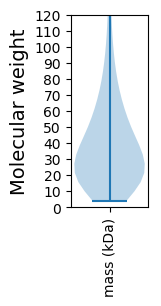
Avg. Mol. Weight |
|---|---|---|---|---|---|---|---|
0 |
227764 |
34 |
5005 |
372.8 |
42.91 |
Amino acid frequency
Ala |
Cys |
Asp |
Glu |
Phe |
Gly |
His |
Ile |
Lys |
Leu |
|---|---|---|---|---|---|---|---|---|---|
4.902 ± 0.087 | 0.664 ± 0.03 |
5.681 ± 0.078 | 5.756 ± 0.118 |
5.16 ± 0.076 | 4.133 ± 0.099 |
1.733 ± 0.034 | 10.323 ± 0.112 |
9.949 ± 0.089 | 10.003 ± 0.097 |
Met |
Asn |
Gln |
Pro |
Arg |
Ser |
Thr |
Val |
Trp |
Tyr |
|---|---|---|---|---|---|---|---|---|---|
1.686 ± 0.058 | 9.069 ± 0.217 |
2.655 ± 0.055 | 3.835 ± 0.056 |
2.768 ± 0.074 | 5.989 ± 0.065 |
5.018 ± 0.085 | 5.36 ± 0.071 |
0.872 ± 0.027 | 4.443 ± 0.062 |
Most of the basic statistics you can see at this page can be downloaded from this CSV file
See this proteome in:

Proteome-pI is available under Creative Commons Attribution-NoDerivs license, for more details see here
| Reference: Kozlowski LP. Proteome-pI 2.0: Proteome Isoelectric Point Database Update. Nucleic Acids Res. 2021, doi: 10.1093/nar/gkab944 | Contact: Lukasz P. Kozlowski |