Escherichia phage SUSP1
Taxonomy: Viruses; Duplodnaviria; Heunggongvirae; Uroviricota; Caudoviricetes; Caudovirales; Myoviridae; Ounavirinae; Suspvirus; Escherichia virus SUSP1
Average proteome isoelectric point is 6.43
Get precalculated fractions of proteins
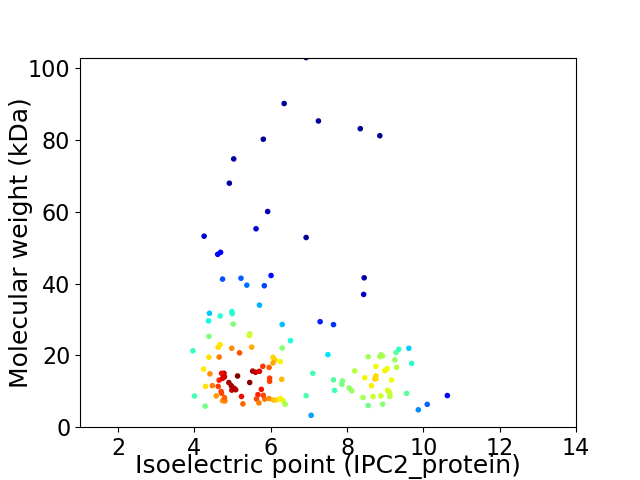
Virtual 2D-PAGE plot for 138 proteins (isoelectric point calculated using IPC2_protein)
Get csv file with sequences according to given criteria:
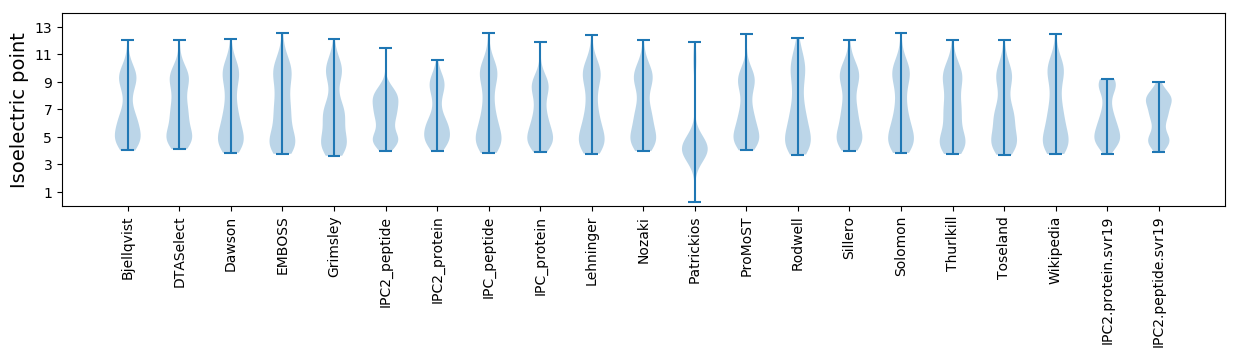
* You can choose from 21 different methods for calculating isoelectric point
Summary statistics related to proteome-wise predictions
Protein with the lowest isoelectric point:
>tr|A0A0N9RSH0|A0A0N9RSH0_9CAUD Uncharacterized protein OS=Escherichia phage SUSP1 OX=1718606 PE=4 SV=1
MM1 pKa = 7.47KK2 pKa = 9.8CFHH5 pKa = 6.61GTTQEE10 pKa = 3.9NFLNLINGGEE20 pKa = 4.22KK21 pKa = 10.27PSGAWNCSDD30 pKa = 3.88MDD32 pKa = 3.81GCFYY36 pKa = 11.02VYY38 pKa = 10.04PVNKK42 pKa = 10.0FYY44 pKa = 11.07DD45 pKa = 3.71VEE47 pKa = 4.9DD48 pKa = 5.1LDD50 pKa = 5.52DD51 pKa = 4.08EE52 pKa = 4.78QITSEE57 pKa = 4.47GIRR60 pKa = 11.84NALDD64 pKa = 3.43SASITAAYY72 pKa = 9.41QMKK75 pKa = 9.49SQKK78 pKa = 10.0IVILEE83 pKa = 3.9LDD85 pKa = 3.49IPEE88 pKa = 5.38EE89 pKa = 4.2DD90 pKa = 4.98LQDD93 pKa = 3.74DD94 pKa = 4.5WSCEE98 pKa = 3.85NMSDD102 pKa = 3.41VASFTEE108 pKa = 4.31YY109 pKa = 10.6FDD111 pKa = 4.59KK112 pKa = 11.09EE113 pKa = 4.51WIKK116 pKa = 10.8KK117 pKa = 9.87IYY119 pKa = 6.98TTEE122 pKa = 3.99FNGMYY127 pKa = 10.57APFFVPNLNNRR138 pKa = 11.84NLGYY142 pKa = 10.27IPDD145 pKa = 3.95EE146 pKa = 4.23LRR148 pKa = 11.84NIAAMIQRR156 pKa = 11.84SDD158 pKa = 3.27EE159 pKa = 4.15MNNVYY164 pKa = 10.21IDD166 pKa = 3.38IFEE169 pKa = 4.3TMQTYY174 pKa = 10.19VSEE177 pKa = 4.26TSISDD182 pKa = 3.46LTAA185 pKa = 4.81
MM1 pKa = 7.47KK2 pKa = 9.8CFHH5 pKa = 6.61GTTQEE10 pKa = 3.9NFLNLINGGEE20 pKa = 4.22KK21 pKa = 10.27PSGAWNCSDD30 pKa = 3.88MDD32 pKa = 3.81GCFYY36 pKa = 11.02VYY38 pKa = 10.04PVNKK42 pKa = 10.0FYY44 pKa = 11.07DD45 pKa = 3.71VEE47 pKa = 4.9DD48 pKa = 5.1LDD50 pKa = 5.52DD51 pKa = 4.08EE52 pKa = 4.78QITSEE57 pKa = 4.47GIRR60 pKa = 11.84NALDD64 pKa = 3.43SASITAAYY72 pKa = 9.41QMKK75 pKa = 9.49SQKK78 pKa = 10.0IVILEE83 pKa = 3.9LDD85 pKa = 3.49IPEE88 pKa = 5.38EE89 pKa = 4.2DD90 pKa = 4.98LQDD93 pKa = 3.74DD94 pKa = 4.5WSCEE98 pKa = 3.85NMSDD102 pKa = 3.41VASFTEE108 pKa = 4.31YY109 pKa = 10.6FDD111 pKa = 4.59KK112 pKa = 11.09EE113 pKa = 4.51WIKK116 pKa = 10.8KK117 pKa = 9.87IYY119 pKa = 6.98TTEE122 pKa = 3.99FNGMYY127 pKa = 10.57APFFVPNLNNRR138 pKa = 11.84NLGYY142 pKa = 10.27IPDD145 pKa = 3.95EE146 pKa = 4.23LRR148 pKa = 11.84NIAAMIQRR156 pKa = 11.84SDD158 pKa = 3.27EE159 pKa = 4.15MNNVYY164 pKa = 10.21IDD166 pKa = 3.38IFEE169 pKa = 4.3TMQTYY174 pKa = 10.19VSEE177 pKa = 4.26TSISDD182 pKa = 3.46LTAA185 pKa = 4.81
Molecular weight: 21.29 kDa
Isoelectric point according different methods:
Protein with the highest isoelectric point:
>tr|A0A0N7GFL1|A0A0N7GFL1_9CAUD Uncharacterized protein OS=Escherichia phage SUSP1 OX=1718606 PE=4 SV=1
MM1 pKa = 7.83GIFSNMKK8 pKa = 10.18AGLLAALAKK17 pKa = 10.2AAAIVSMTGKK27 pKa = 9.96QVGVDD32 pKa = 3.75ASAVAQVFASQIGQQPYY49 pKa = 8.63IHH51 pKa = 6.6VGRR54 pKa = 11.84GKK56 pKa = 10.52GGKK59 pKa = 8.68KK60 pKa = 8.45QAHH63 pKa = 5.92RR64 pKa = 11.84QTGAAAIKK72 pKa = 10.1RR73 pKa = 11.84AAKK76 pKa = 9.87KK77 pKa = 9.93ARR79 pKa = 11.84NRR81 pKa = 11.84KK82 pKa = 8.88RR83 pKa = 11.84SKK85 pKa = 10.72
MM1 pKa = 7.83GIFSNMKK8 pKa = 10.18AGLLAALAKK17 pKa = 10.2AAAIVSMTGKK27 pKa = 9.96QVGVDD32 pKa = 3.75ASAVAQVFASQIGQQPYY49 pKa = 8.63IHH51 pKa = 6.6VGRR54 pKa = 11.84GKK56 pKa = 10.52GGKK59 pKa = 8.68KK60 pKa = 8.45QAHH63 pKa = 5.92RR64 pKa = 11.84QTGAAAIKK72 pKa = 10.1RR73 pKa = 11.84AAKK76 pKa = 9.87KK77 pKa = 9.93ARR79 pKa = 11.84NRR81 pKa = 11.84KK82 pKa = 8.88RR83 pKa = 11.84SKK85 pKa = 10.72
Molecular weight: 8.82 kDa
Isoelectric point according different methods:
Peptides (in silico digests for buttom-up proteomics)
Below you can find in silico digests of the whole proteome with Trypsin, Chymotrypsin, Trypsin+LysC, LysN, ArgC proteases suitable for different mass spec machines.| Try ESI |
 |
|---|
| ChTry ESI |
|
|---|
| ArgC ESI |
|
|---|
| LysN ESI |
|
|---|
| TryLysC ESI |
|
|---|
| Try MALDI |
|
|---|
| ChTry MALDI |
|
|---|
| ArgC MALDI |
|
|---|
| LysN MALDI |
|
|---|
| TryLysC MALDI |
|
|---|
| Try LTQ |
|
|---|
| ChTry LTQ |
|
|---|
| ArgC LTQ |
|
|---|
| LysN LTQ |
|
|---|
| TryLysC LTQ |
|
|---|
| Try MSlow |
|
|---|
| ChTry MSlow |
|
|---|
| ArgC MSlow |
|
|---|
| LysN MSlow |
|
|---|
| TryLysC MSlow |
|
|---|
| Try MShigh |
|
|---|
| ChTry MShigh |
|
|---|
| ArgC MShigh |
|
|---|
| LysN MShigh |
|
|---|
| TryLysC MShigh |
|
|---|
General Statistics
Number of major isoforms |
Number of additional isoforms |
Number of all proteins |
Number of amino acids |
Min. Seq. Length |
Max. Seq. Length |
Avg. Seq. Length |
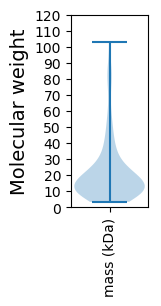
Avg. Mol. Weight |
|---|---|---|---|---|---|---|---|
0 |
26755 |
29 |
899 |
193.9 |
21.89 |
Amino acid frequency
Ala |
Cys |
Asp |
Glu |
Phe |
Gly |
His |
Ile |
Lys |
Leu |
|---|---|---|---|---|---|---|---|---|---|
7.307 ± 0.26 | 1.346 ± 0.107 |
6.227 ± 0.169 | 6.761 ± 0.203 |
4.302 ± 0.141 | 6.533 ± 0.209 |
1.996 ± 0.116 | 5.92 ± 0.137 |
7.842 ± 0.273 | 7.763 ± 0.166 |
Met |
Asn |
Gln |
Pro |
Arg |
Ser |
Thr |
Val |
Trp |
Tyr |
|---|---|---|---|---|---|---|---|---|---|
2.994 ± 0.111 | 5.18 ± 0.144 |
2.968 ± 0.134 | 3.64 ± 0.144 |
4.298 ± 0.14 | 6.234 ± 0.192 |
6.32 ± 0.261 | 6.817 ± 0.159 |
1.174 ± 0.099 | 4.377 ± 0.143 |
Most of the basic statistics you can see at this page can be downloaded from this CSV file
See this proteome in:

Proteome-pI is available under Creative Commons Attribution-NoDerivs license, for more details see here
| Reference: Kozlowski LP. Proteome-pI 2.0: Proteome Isoelectric Point Database Update. Nucleic Acids Res. 2021, doi: 10.1093/nar/gkab944 | Contact: Lukasz P. Kozlowski |