Lachnospiraceae bacterium XBD2001
Taxonomy: cellular organisms; Bacteria; Terrabacteria group; Firmicutes; Clostridia; Eubacteriales; Lachnospiraceae; unclassified Lachnospiraceae
Average proteome isoelectric point is 5.67
Get precalculated fractions of proteins

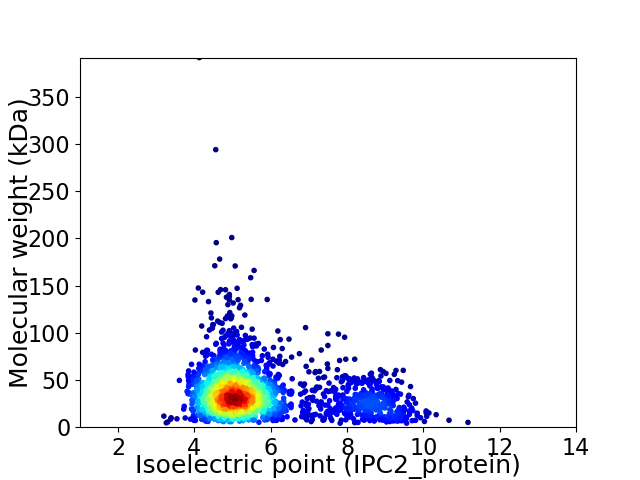
Virtual 2D-PAGE plot for 2215 proteins (isoelectric point calculated using IPC2_protein)
Get csv file with sequences according to given criteria:
* You can choose from 21 different methods for calculating isoelectric point
Summary statistics related to proteome-wise predictions


Protein with the lowest isoelectric point:
>tr|A0A1I6XDN4|A0A1I6XDN4_9FIRM Multimeric flavodoxin WrbA OS=Lachnospiraceae bacterium XBD2001 OX=1520820 GN=SAMN02910301_0694 PE=4 SV=1
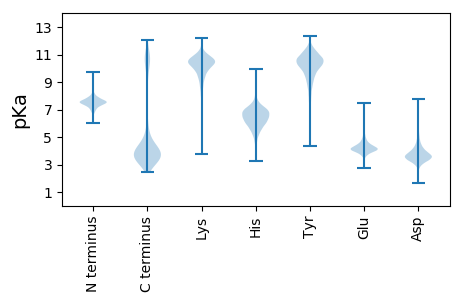
MM1 pKa = 7.55RR2 pKa = 11.84RR3 pKa = 11.84TWLLVGMSVMLMLSVSACGTKK24 pKa = 9.62TEE26 pKa = 4.29NTATPQAPDD35 pKa = 3.53AEE37 pKa = 4.44PVIEE41 pKa = 4.45EE42 pKa = 4.31PATEE46 pKa = 4.01EE47 pKa = 4.26PEE49 pKa = 4.62AEE51 pKa = 4.16EE52 pKa = 5.0SDD54 pKa = 3.63TGLANPWTEE63 pKa = 3.74SDD65 pKa = 3.71RR66 pKa = 11.84EE67 pKa = 4.24GVLAATGFDD76 pKa = 4.01LNVPDD81 pKa = 3.71EE82 pKa = 4.78AEE84 pKa = 4.09NVVYY88 pKa = 10.5SYY90 pKa = 11.08MEE92 pKa = 4.59ADD94 pKa = 3.47KK95 pKa = 9.93MAQVSYY101 pKa = 11.44VMNNHH106 pKa = 6.53DD107 pKa = 2.88WTYY110 pKa = 10.9RR111 pKa = 11.84VQPTDD116 pKa = 3.23GLQDD120 pKa = 3.28ISGMYY125 pKa = 8.89YY126 pKa = 9.81EE127 pKa = 4.98WVAEE131 pKa = 3.91EE132 pKa = 4.16DD133 pKa = 4.01TNVANHH139 pKa = 5.51EE140 pKa = 4.33AEE142 pKa = 3.64IKK144 pKa = 10.57AYY146 pKa = 10.46VEE148 pKa = 4.36NNGDD152 pKa = 4.07PDD154 pKa = 3.9NLDD157 pKa = 3.9DD158 pKa = 3.99MFSVQVLNWYY168 pKa = 8.94DD169 pKa = 3.33ATEE172 pKa = 4.4GATHH176 pKa = 6.22SVSISGGAVDD186 pKa = 5.72GLDD189 pKa = 3.15LSVYY193 pKa = 10.73AEE195 pKa = 4.34DD196 pKa = 3.47MWMKK200 pKa = 10.92
MM1 pKa = 7.55RR2 pKa = 11.84RR3 pKa = 11.84TWLLVGMSVMLMLSVSACGTKK24 pKa = 9.62TEE26 pKa = 4.29NTATPQAPDD35 pKa = 3.53AEE37 pKa = 4.44PVIEE41 pKa = 4.45EE42 pKa = 4.31PATEE46 pKa = 4.01EE47 pKa = 4.26PEE49 pKa = 4.62AEE51 pKa = 4.16EE52 pKa = 5.0SDD54 pKa = 3.63TGLANPWTEE63 pKa = 3.74SDD65 pKa = 3.71RR66 pKa = 11.84EE67 pKa = 4.24GVLAATGFDD76 pKa = 4.01LNVPDD81 pKa = 3.71EE82 pKa = 4.78AEE84 pKa = 4.09NVVYY88 pKa = 10.5SYY90 pKa = 11.08MEE92 pKa = 4.59ADD94 pKa = 3.47KK95 pKa = 9.93MAQVSYY101 pKa = 11.44VMNNHH106 pKa = 6.53DD107 pKa = 2.88WTYY110 pKa = 10.9RR111 pKa = 11.84VQPTDD116 pKa = 3.23GLQDD120 pKa = 3.28ISGMYY125 pKa = 8.89YY126 pKa = 9.81EE127 pKa = 4.98WVAEE131 pKa = 3.91EE132 pKa = 4.16DD133 pKa = 4.01TNVANHH139 pKa = 5.51EE140 pKa = 4.33AEE142 pKa = 3.64IKK144 pKa = 10.57AYY146 pKa = 10.46VEE148 pKa = 4.36NNGDD152 pKa = 4.07PDD154 pKa = 3.9NLDD157 pKa = 3.9DD158 pKa = 3.99MFSVQVLNWYY168 pKa = 8.94DD169 pKa = 3.33ATEE172 pKa = 4.4GATHH176 pKa = 6.22SVSISGGAVDD186 pKa = 5.72GLDD189 pKa = 3.15LSVYY193 pKa = 10.73AEE195 pKa = 4.34DD196 pKa = 3.47MWMKK200 pKa = 10.92
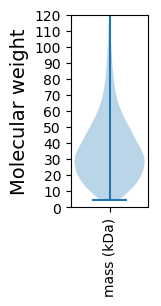
Molecular weight: 22.14 kDa
Isoelectric point according different methods:
Protein with the highest isoelectric point:
>tr|A0A1I6YRQ9|A0A1I6YRQ9_9FIRM Indole-3-glycerol phosphate synthase OS=Lachnospiraceae bacterium XBD2001 OX=1520820 GN=trpC PE=3 SV=1
MM1 pKa = 7.67KK2 pKa = 8.72MTFQPKK8 pKa = 8.79KK9 pKa = 7.6RR10 pKa = 11.84QRR12 pKa = 11.84AKK14 pKa = 9.2VHH16 pKa = 5.65GFRR19 pKa = 11.84SRR21 pKa = 11.84MSSKK25 pKa = 10.62GGRR28 pKa = 11.84KK29 pKa = 8.94VLASRR34 pKa = 11.84RR35 pKa = 11.84AKK37 pKa = 9.74GRR39 pKa = 11.84KK40 pKa = 8.92RR41 pKa = 11.84LSAA44 pKa = 3.96
MM1 pKa = 7.67KK2 pKa = 8.72MTFQPKK8 pKa = 8.79KK9 pKa = 7.6RR10 pKa = 11.84QRR12 pKa = 11.84AKK14 pKa = 9.2VHH16 pKa = 5.65GFRR19 pKa = 11.84SRR21 pKa = 11.84MSSKK25 pKa = 10.62GGRR28 pKa = 11.84KK29 pKa = 8.94VLASRR34 pKa = 11.84RR35 pKa = 11.84AKK37 pKa = 9.74GRR39 pKa = 11.84KK40 pKa = 8.92RR41 pKa = 11.84LSAA44 pKa = 3.96
Molecular weight: 5.1 kDa
Isoelectric point according different methods:
Peptides (in silico digests for buttom-up proteomics)
Below you can find in silico digests of the whole proteome with Trypsin, Chymotrypsin, Trypsin+LysC, LysN, ArgC proteases suitable for different mass spec machines.| Try ESI |
 |
|---|
| ChTry ESI |
 |
|---|
| ArgC ESI |
 |
|---|
| LysN ESI |
 |
|---|
| TryLysC ESI |
 |
|---|
| Try MALDI |
 |
|---|
| ChTry MALDI |
 |
|---|
| ArgC MALDI |
 |
|---|
| LysN MALDI |
 |
|---|
| TryLysC MALDI |
 |
|---|
| Try LTQ |
 |
|---|
| ChTry LTQ |
 |
|---|
| ArgC LTQ |
 |
|---|
| LysN LTQ |
 |
|---|
| TryLysC LTQ |
 |
|---|
| Try MSlow |
 |
|---|
| ChTry MSlow |
 |
|---|
| ArgC MSlow |
 |
|---|
| LysN MSlow |
 |
|---|
| TryLysC MSlow |
 |
|---|
| Try MShigh |
 |
|---|
| ChTry MShigh |
 |
|---|
| ArgC MShigh |
 |
|---|
| LysN MShigh |
 |
|---|
| TryLysC MShigh |
 |
|---|
General Statistics
Number of major isoforms |
Number of additional isoforms |
Number of all proteins |
Number of amino acids |
Min. Seq. Length |
Max. Seq. Length |
Avg. Seq. Length |
Avg. Mol. Weight |
|---|---|---|---|---|---|---|---|
0 |
756667 |
37 |
3687 |
341.6 |
38.17 |
Amino acid frequency
Ala |
Cys |
Asp |
Glu |
Phe |
Gly |
His |
Ile |
Lys |
Leu |
|---|---|---|---|---|---|---|---|---|---|
8.092 ± 0.057 | 1.35 ± 0.021 |
6.129 ± 0.041 | 7.552 ± 0.06 |
4.08 ± 0.04 | 7.113 ± 0.042 |
1.877 ± 0.023 | 7.035 ± 0.051 |
6.032 ± 0.05 | 8.766 ± 0.059 |
Met |
Asn |
Gln |
Pro |
Arg |
Ser |
Thr |
Val |
Trp |
Tyr |
|---|---|---|---|---|---|---|---|---|---|
3.17 ± 0.029 | 4.363 ± 0.035 |
3.288 ± 0.025 | 3.161 ± 0.027 |
4.314 ± 0.041 | 5.624 ± 0.04 |
5.593 ± 0.069 | 7.356 ± 0.046 |
0.889 ± 0.017 | 4.216 ± 0.038 |
Most of the basic statistics you can see at this page can be downloaded from this CSV file
Proteome-pI is available under Creative Commons Attribution-NoDerivs license, for more details see here
| Reference: Kozlowski LP. Proteome-pI 2.0: Proteome Isoelectric Point Database Update. Nucleic Acids Res. 2021, doi: 10.1093/nar/gkab944 | Contact: Lukasz P. Kozlowski |
