Kafue kinda chacma baboon virus
Taxonomy: Viruses; Riboviria; Orthornavirae; Pisuviricota; Pisoniviricetes; Nidovirales; Arnidovirineae; Arteriviridae; Simarterivirinae; Thetaarterivirus; Kaftartevirus; Thetaarterivirus kafuba
Average proteome isoelectric point is 7.88
Get precalculated fractions of proteins

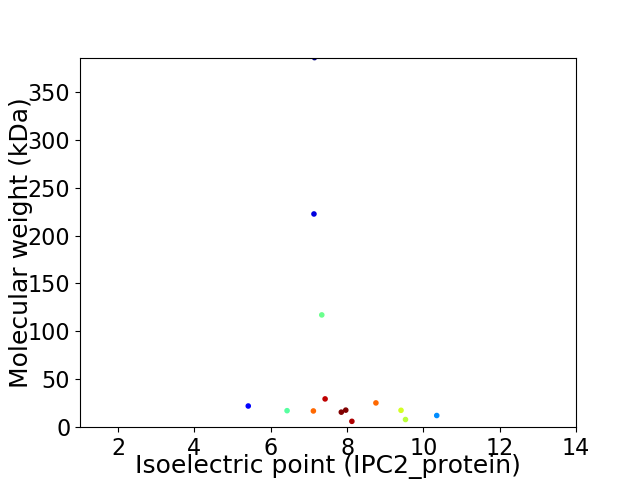
Virtual 2D-PAGE plot for 14 proteins (isoelectric point calculated using IPC2_protein)
Get csv file with sequences according to given criteria:
* You can choose from 21 different methods for calculating isoelectric point
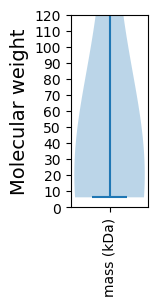
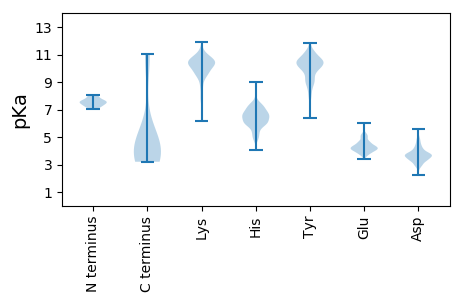
Summary statistics related to proteome-wise predictions


Protein with the lowest isoelectric point:
>tr|A0A0Y0DFZ4|A0A0Y0DFZ4_9NIDO E protein OS=Kafue kinda chacma baboon virus OX=1823757 GN=ORF2a PE=4 SV=1
MM1 pKa = 7.85ASGLHH6 pKa = 5.74VRR8 pKa = 11.84LISCLCVFYY17 pKa = 10.68LVRR20 pKa = 11.84SSGANINSTDD30 pKa = 3.57TAPEE34 pKa = 5.09GICFLLPVKK43 pKa = 10.75HH44 pKa = 6.04NVLVNISLHH53 pKa = 5.68TLFCTNDD60 pKa = 3.32GAISMEE66 pKa = 3.55VDD68 pKa = 3.17EE69 pKa = 4.92NHH71 pKa = 6.93FGNDD75 pKa = 3.55DD76 pKa = 3.83CPLSGFKK83 pKa = 10.25PHH85 pKa = 7.02GSTTGKK91 pKa = 10.36YY92 pKa = 10.65GSFLHH97 pKa = 6.38MSDD100 pKa = 3.79INFPLNLTTDD110 pKa = 3.81PSHH113 pKa = 8.29VYY115 pKa = 8.44ITILLTYY122 pKa = 10.64LMANFPQVLIPNHH135 pKa = 5.39NTSLPLALNATVTNTTWQFCINSTNIPSVGSGPIVDD171 pKa = 5.61LYY173 pKa = 9.03TTGPPWGLYY182 pKa = 9.59YY183 pKa = 9.94MEE185 pKa = 5.38LLRR188 pKa = 11.84PFLLSLLMLGLSHH201 pKa = 7.63II202 pKa = 4.67
MM1 pKa = 7.85ASGLHH6 pKa = 5.74VRR8 pKa = 11.84LISCLCVFYY17 pKa = 10.68LVRR20 pKa = 11.84SSGANINSTDD30 pKa = 3.57TAPEE34 pKa = 5.09GICFLLPVKK43 pKa = 10.75HH44 pKa = 6.04NVLVNISLHH53 pKa = 5.68TLFCTNDD60 pKa = 3.32GAISMEE66 pKa = 3.55VDD68 pKa = 3.17EE69 pKa = 4.92NHH71 pKa = 6.93FGNDD75 pKa = 3.55DD76 pKa = 3.83CPLSGFKK83 pKa = 10.25PHH85 pKa = 7.02GSTTGKK91 pKa = 10.36YY92 pKa = 10.65GSFLHH97 pKa = 6.38MSDD100 pKa = 3.79INFPLNLTTDD110 pKa = 3.81PSHH113 pKa = 8.29VYY115 pKa = 8.44ITILLTYY122 pKa = 10.64LMANFPQVLIPNHH135 pKa = 5.39NTSLPLALNATVTNTTWQFCINSTNIPSVGSGPIVDD171 pKa = 5.61LYY173 pKa = 9.03TTGPPWGLYY182 pKa = 9.59YY183 pKa = 9.94MEE185 pKa = 5.38LLRR188 pKa = 11.84PFLLSLLMLGLSHH201 pKa = 7.63II202 pKa = 4.67
Molecular weight: 22.12 kDa
Isoelectric point according different methods:
Protein with the highest isoelectric point:
>tr|A0A0Y0BL84|A0A0Y0BL84_9NIDO N protein OS=Kafue kinda chacma baboon virus OX=1823757 GN=ORF7 PE=4 SV=1
MM1 pKa = 7.24VSSICSDD8 pKa = 3.31PGYY11 pKa = 7.77TTIAFTAAPIVIACLRR27 pKa = 11.84LFRR30 pKa = 11.84PCLRR34 pKa = 11.84GFFCALCIATLAYY47 pKa = 10.21AATAFQEE54 pKa = 4.31HH55 pKa = 6.43SLATIVTISFACIYY69 pKa = 10.55CGFKK73 pKa = 10.53LLQWIIIRR81 pKa = 11.84FRR83 pKa = 11.84MCRR86 pKa = 11.84LGPGYY91 pKa = 10.13ILSSPNHH98 pKa = 5.95VDD100 pKa = 2.97SSLGRR105 pKa = 11.84YY106 pKa = 7.8PITGTGSSAIVTRR119 pKa = 11.84RR120 pKa = 11.84SGMTIANNQLIPDD133 pKa = 4.48VKK135 pKa = 10.86RR136 pKa = 11.84MVLAGKK142 pKa = 9.75IATKK146 pKa = 10.28KK147 pKa = 10.64GLVNLRR153 pKa = 11.84KK154 pKa = 10.28YY155 pKa = 10.34GWQKK159 pKa = 9.55TKK161 pKa = 11.02
MM1 pKa = 7.24VSSICSDD8 pKa = 3.31PGYY11 pKa = 7.77TTIAFTAAPIVIACLRR27 pKa = 11.84LFRR30 pKa = 11.84PCLRR34 pKa = 11.84GFFCALCIATLAYY47 pKa = 10.21AATAFQEE54 pKa = 4.31HH55 pKa = 6.43SLATIVTISFACIYY69 pKa = 10.55CGFKK73 pKa = 10.53LLQWIIIRR81 pKa = 11.84FRR83 pKa = 11.84MCRR86 pKa = 11.84LGPGYY91 pKa = 10.13ILSSPNHH98 pKa = 5.95VDD100 pKa = 2.97SSLGRR105 pKa = 11.84YY106 pKa = 7.8PITGTGSSAIVTRR119 pKa = 11.84RR120 pKa = 11.84SGMTIANNQLIPDD133 pKa = 4.48VKK135 pKa = 10.86RR136 pKa = 11.84MVLAGKK142 pKa = 9.75IATKK146 pKa = 10.28KK147 pKa = 10.64GLVNLRR153 pKa = 11.84KK154 pKa = 10.28YY155 pKa = 10.34GWQKK159 pKa = 9.55TKK161 pKa = 11.02
Molecular weight: 17.63 kDa
Isoelectric point according different methods:
Peptides (in silico digests for buttom-up proteomics)
Below you can find in silico digests of the whole proteome with Trypsin, Chymotrypsin, Trypsin+LysC, LysN, ArgC proteases suitable for different mass spec machines.| Try ESI |
 |
|---|
| ChTry ESI |
 |
|---|
| ArgC ESI |
 |
|---|
| LysN ESI |
 |
|---|
| TryLysC ESI |
 |
|---|
| Try MALDI |
 |
|---|
| ChTry MALDI |
 |
|---|
| ArgC MALDI |
 |
|---|
| LysN MALDI |
 |
|---|
| TryLysC MALDI |
 |
|---|
| Try LTQ |
 |
|---|
| ChTry LTQ |
 |
|---|
| ArgC LTQ |
 |
|---|
| LysN LTQ |
 |
|---|
| TryLysC LTQ |
 |
|---|
| Try MSlow |
 |
|---|
| ChTry MSlow |
 |
|---|
| ArgC MSlow |
 |
|---|
| LysN MSlow |
 |
|---|
| TryLysC MSlow |
 |
|---|
| Try MShigh |
 |
|---|
| ChTry MShigh |
 |
|---|
| ArgC MShigh |
 |
|---|
| LysN MShigh |
 |
|---|
| TryLysC MShigh |
 |
|---|
General Statistics
Number of major isoforms |
Number of additional isoforms |
Number of all proteins |
Number of amino acids |
Min. Seq. Length |
Max. Seq. Length |
Avg. Seq. Length |
Avg. Mol. Weight |
|---|---|---|---|---|---|---|---|
0 |
8350 |
50 |
3535 |
596.4 |
65.29 |
Amino acid frequency
Ala |
Cys |
Asp |
Glu |
Phe |
Gly |
His |
Ile |
Lys |
Leu |
|---|---|---|---|---|---|---|---|---|---|
8.287 ± 0.273 | 3.102 ± 0.157 |
4.084 ± 0.514 | 3.377 ± 0.338 |
4.683 ± 0.284 | 6.982 ± 0.551 |
3.054 ± 0.334 | 5.21 ± 0.427 |
3.796 ± 0.302 | 10.527 ± 0.549 |
Met |
Asn |
Gln |
Pro |
Arg |
Ser |
Thr |
Val |
Trp |
Tyr |
|---|---|---|---|---|---|---|---|---|---|
1.617 ± 0.109 | 3.593 ± 0.342 |
6.671 ± 0.531 | 3.114 ± 0.362 |
4.659 ± 0.295 | 7.988 ± 0.299 |
6.743 ± 0.389 | 7.593 ± 0.365 |
1.102 ± 0.196 | 3.82 ± 0.1 |
Most of the basic statistics you can see at this page can be downloaded from this CSV file
Proteome-pI is available under Creative Commons Attribution-NoDerivs license, for more details see here
| Reference: Kozlowski LP. Proteome-pI 2.0: Proteome Isoelectric Point Database Update. Nucleic Acids Res. 2021, doi: 10.1093/nar/gkab944 | Contact: Lukasz P. Kozlowski |
