Aurantibacter aestuarii
Taxonomy: cellular organisms; Bacteria; FCB group; Bacteroidetes/Chlorobi group; Bacteroidetes; Flavobacteriia; Flavobacteriales; Flavobacteriaceae; Aurantibacter
Average proteome isoelectric point is 6.58
Get precalculated fractions of proteins

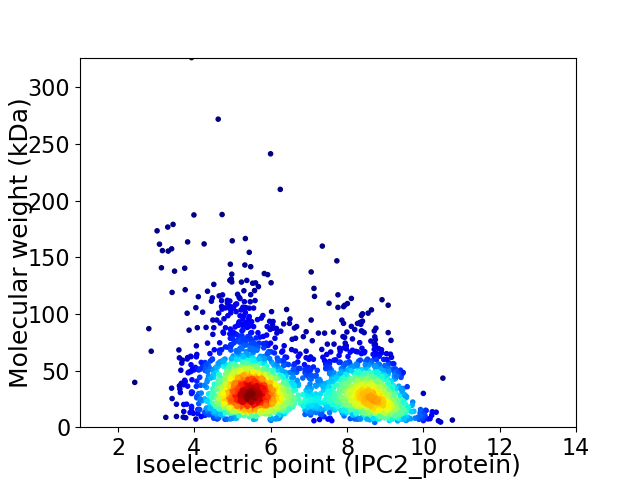
Virtual 2D-PAGE plot for 2594 proteins (isoelectric point calculated using IPC2_protein)
Get csv file with sequences according to given criteria:
* You can choose from 21 different methods for calculating isoelectric point
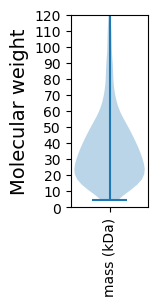
Summary statistics related to proteome-wise predictions


Protein with the lowest isoelectric point:
>tr|A0A2T1N5N3|A0A2T1N5N3_9FLAO Carboxymuconolactone decarboxylase family protein OS=Aurantibacter aestuarii OX=1266046 GN=C7H52_12820 PE=4 SV=1
MM1 pKa = 7.49KK2 pKa = 10.49LLNRR6 pKa = 11.84FLGLAILLALFTTSCSSDD24 pKa = 3.21DD25 pKa = 3.97DD26 pKa = 4.98GINVGQSPSVPLGAYY41 pKa = 9.19EE42 pKa = 4.14NGTFILNEE50 pKa = 4.08GSSAATAGVDD60 pKa = 4.01FLSDD64 pKa = 3.41AGVLTSDD71 pKa = 3.9VFRR74 pKa = 11.84IEE76 pKa = 5.18NPDD79 pKa = 3.45EE80 pKa = 5.24DD81 pKa = 4.3EE82 pKa = 6.18LGLFLQNIFFDD93 pKa = 3.75DD94 pKa = 3.26TRR96 pKa = 11.84AFIISGGTSSITVVNRR112 pKa = 11.84YY113 pKa = 5.55TFKK116 pKa = 10.98FITSIEE122 pKa = 4.32TNLDD126 pKa = 3.19NPRR129 pKa = 11.84YY130 pKa = 9.84GIVVNGKK137 pKa = 10.41AYY139 pKa = 8.74VTNQAGFSTGADD151 pKa = 3.16DD152 pKa = 5.31FVTVINLSNYY162 pKa = 7.18STSTVLIGDD171 pKa = 3.76YY172 pKa = 10.74VDD174 pKa = 5.69RR175 pKa = 11.84ITFAGDD181 pKa = 3.02KK182 pKa = 10.69VVIANGAFGSGNGVTFLNTTNNSFQTLDD210 pKa = 3.63LGAGNSPNSLIAVNDD225 pKa = 3.32NVYY228 pKa = 11.28ALTGNNKK235 pKa = 9.19FFQIDD240 pKa = 3.62ANTATLSSTLDD251 pKa = 3.02IPAAISGVKK260 pKa = 9.92NLQIEE265 pKa = 4.03NDD267 pKa = 3.67EE268 pKa = 4.69VYY270 pKa = 8.9FTADD274 pKa = 2.79TSVYY278 pKa = 10.84SFGLGDD284 pKa = 3.75TTVSTTPLFTYY295 pKa = 10.67NSTSQFGAMYY305 pKa = 10.08GFSVSDD311 pKa = 3.28NSIFVGDD318 pKa = 4.18AGDD321 pKa = 3.53FASAGTFFEE330 pKa = 4.73YY331 pKa = 8.34TTAGTLVDD339 pKa = 4.56SYY341 pKa = 10.31TSSGVGPNGFYY352 pKa = 10.98KK353 pKa = 10.8NN354 pKa = 3.55
MM1 pKa = 7.49KK2 pKa = 10.49LLNRR6 pKa = 11.84FLGLAILLALFTTSCSSDD24 pKa = 3.21DD25 pKa = 3.97DD26 pKa = 4.98GINVGQSPSVPLGAYY41 pKa = 9.19EE42 pKa = 4.14NGTFILNEE50 pKa = 4.08GSSAATAGVDD60 pKa = 4.01FLSDD64 pKa = 3.41AGVLTSDD71 pKa = 3.9VFRR74 pKa = 11.84IEE76 pKa = 5.18NPDD79 pKa = 3.45EE80 pKa = 5.24DD81 pKa = 4.3EE82 pKa = 6.18LGLFLQNIFFDD93 pKa = 3.75DD94 pKa = 3.26TRR96 pKa = 11.84AFIISGGTSSITVVNRR112 pKa = 11.84YY113 pKa = 5.55TFKK116 pKa = 10.98FITSIEE122 pKa = 4.32TNLDD126 pKa = 3.19NPRR129 pKa = 11.84YY130 pKa = 9.84GIVVNGKK137 pKa = 10.41AYY139 pKa = 8.74VTNQAGFSTGADD151 pKa = 3.16DD152 pKa = 5.31FVTVINLSNYY162 pKa = 7.18STSTVLIGDD171 pKa = 3.76YY172 pKa = 10.74VDD174 pKa = 5.69RR175 pKa = 11.84ITFAGDD181 pKa = 3.02KK182 pKa = 10.69VVIANGAFGSGNGVTFLNTTNNSFQTLDD210 pKa = 3.63LGAGNSPNSLIAVNDD225 pKa = 3.32NVYY228 pKa = 11.28ALTGNNKK235 pKa = 9.19FFQIDD240 pKa = 3.62ANTATLSSTLDD251 pKa = 3.02IPAAISGVKK260 pKa = 9.92NLQIEE265 pKa = 4.03NDD267 pKa = 3.67EE268 pKa = 4.69VYY270 pKa = 8.9FTADD274 pKa = 2.79TSVYY278 pKa = 10.84SFGLGDD284 pKa = 3.75TTVSTTPLFTYY295 pKa = 10.67NSTSQFGAMYY305 pKa = 10.08GFSVSDD311 pKa = 3.28NSIFVGDD318 pKa = 4.18AGDD321 pKa = 3.53FASAGTFFEE330 pKa = 4.73YY331 pKa = 8.34TTAGTLVDD339 pKa = 4.56SYY341 pKa = 10.31TSSGVGPNGFYY352 pKa = 10.98KK353 pKa = 10.8NN354 pKa = 3.55
Molecular weight: 37.42 kDa
Isoelectric point according different methods:
Protein with the highest isoelectric point:
>tr|A0A2T1N5H3|A0A2T1N5H3_9FLAO Adenylosuccinate lyase OS=Aurantibacter aestuarii OX=1266046 GN=C7H52_12505 PE=3 SV=1
MM1 pKa = 7.69SKK3 pKa = 9.01RR4 pKa = 11.84TFQPSKK10 pKa = 9.13RR11 pKa = 11.84KK12 pKa = 9.48RR13 pKa = 11.84RR14 pKa = 11.84NKK16 pKa = 9.49HH17 pKa = 3.94GFRR20 pKa = 11.84EE21 pKa = 4.27RR22 pKa = 11.84MASANGRR29 pKa = 11.84KK30 pKa = 9.04VLARR34 pKa = 11.84RR35 pKa = 11.84RR36 pKa = 11.84AKK38 pKa = 10.09GRR40 pKa = 11.84KK41 pKa = 7.97KK42 pKa = 10.6LSVSSEE48 pKa = 4.04SRR50 pKa = 11.84HH51 pKa = 5.63KK52 pKa = 10.69KK53 pKa = 9.55
MM1 pKa = 7.69SKK3 pKa = 9.01RR4 pKa = 11.84TFQPSKK10 pKa = 9.13RR11 pKa = 11.84KK12 pKa = 9.48RR13 pKa = 11.84RR14 pKa = 11.84NKK16 pKa = 9.49HH17 pKa = 3.94GFRR20 pKa = 11.84EE21 pKa = 4.27RR22 pKa = 11.84MASANGRR29 pKa = 11.84KK30 pKa = 9.04VLARR34 pKa = 11.84RR35 pKa = 11.84RR36 pKa = 11.84AKK38 pKa = 10.09GRR40 pKa = 11.84KK41 pKa = 7.97KK42 pKa = 10.6LSVSSEE48 pKa = 4.04SRR50 pKa = 11.84HH51 pKa = 5.63KK52 pKa = 10.69KK53 pKa = 9.55
Molecular weight: 6.31 kDa
Isoelectric point according different methods:
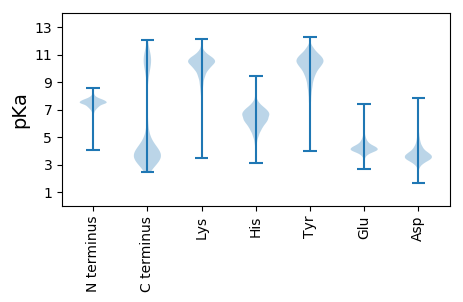
Peptides (in silico digests for buttom-up proteomics)
Below you can find in silico digests of the whole proteome with Trypsin, Chymotrypsin, Trypsin+LysC, LysN, ArgC proteases suitable for different mass spec machines.| Try ESI |
 |
|---|
| ChTry ESI |
 |
|---|
| ArgC ESI |
 |
|---|
| LysN ESI |
 |
|---|
| TryLysC ESI |
 |
|---|
| Try MALDI |
 |
|---|
| ChTry MALDI |
 |
|---|
| ArgC MALDI |
 |
|---|
| LysN MALDI |
 |
|---|
| TryLysC MALDI |
 |
|---|
| Try LTQ |
 |
|---|
| ChTry LTQ |
 |
|---|
| ArgC LTQ |
 |
|---|
| LysN LTQ |
 |
|---|
| TryLysC LTQ |
 |
|---|
| Try MSlow |
 |
|---|
| ChTry MSlow |
 |
|---|
| ArgC MSlow |
 |
|---|
| LysN MSlow |
 |
|---|
| TryLysC MSlow |
 |
|---|
| Try MShigh |
 |
|---|
| ChTry MShigh |
 |
|---|
| ArgC MShigh |
 |
|---|
| LysN MShigh |
 |
|---|
| TryLysC MShigh |
 |
|---|
General Statistics
Number of major isoforms |
Number of additional isoforms |
Number of all proteins |
Number of amino acids |
Min. Seq. Length |
Max. Seq. Length |
Avg. Seq. Length |
Avg. Mol. Weight |
|---|---|---|---|---|---|---|---|
0 |
888837 |
38 |
3003 |
342.7 |
38.67 |
Amino acid frequency
Ala |
Cys |
Asp |
Glu |
Phe |
Gly |
His |
Ile |
Lys |
Leu |
|---|---|---|---|---|---|---|---|---|---|
6.27 ± 0.042 | 0.76 ± 0.014 |
5.555 ± 0.04 | 6.385 ± 0.055 |
5.461 ± 0.042 | 6.059 ± 0.055 |
1.74 ± 0.024 | 7.9 ± 0.049 |
7.935 ± 0.078 | 9.453 ± 0.06 |
Met |
Asn |
Gln |
Pro |
Arg |
Ser |
Thr |
Val |
Trp |
Tyr |
|---|---|---|---|---|---|---|---|---|---|
1.947 ± 0.023 | 6.799 ± 0.058 |
3.237 ± 0.029 | 3.429 ± 0.025 |
3.066 ± 0.032 | 6.541 ± 0.038 |
6.246 ± 0.063 | 6.152 ± 0.033 |
0.934 ± 0.017 | 4.129 ± 0.034 |
Most of the basic statistics you can see at this page can be downloaded from this CSV file
Proteome-pI is available under Creative Commons Attribution-NoDerivs license, for more details see here
| Reference: Kozlowski LP. Proteome-pI 2.0: Proteome Isoelectric Point Database Update. Nucleic Acids Res. 2021, doi: 10.1093/nar/gkab944 | Contact: Lukasz P. Kozlowski |
