Prochlorococcus marinus (strain MIT 9301)
Taxonomy: cellular organisms; Bacteria; Terrabacteria group; Cyanobacteria/Melainabacteria group; Cyanobacteria; Synechococcales; Prochloraceae; Prochlorococcus; Prochlorococcus marinus
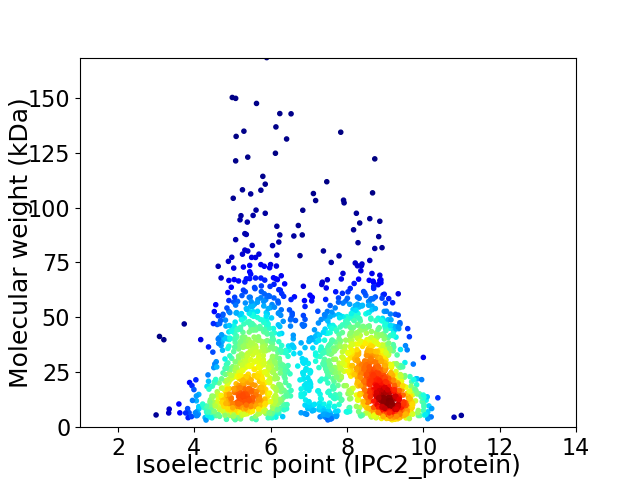
Average proteome isoelectric point is 7.06
Get precalculated fractions of proteins

Virtual 2D-PAGE plot for 1906 proteins (isoelectric point calculated using IPC2_protein)
Get csv file with sequences according to given criteria:
* You can choose from 21 different methods for calculating isoelectric point
Summary statistics related to proteome-wise predictions


Protein with the lowest isoelectric point:
>tr|A3PDW5|A3PDW5_PROM0 Uncharacterized protein OS=Prochlorococcus marinus (strain MIT 9301) OX=167546 GN=P9301_13171 PE=4 SV=1
MM1 pKa = 7.45SALKK5 pKa = 10.61SFAALSIASMSILPLTPEE23 pKa = 4.78LKK25 pKa = 10.59ADD27 pKa = 3.99DD28 pKa = 4.26YY29 pKa = 11.96EE30 pKa = 5.27KK31 pKa = 11.26GFYY34 pKa = 8.86GTIGAGAGTFSDD46 pKa = 4.33LLLVGTPFALAFDD59 pKa = 4.59PGFSYY64 pKa = 10.6EE65 pKa = 4.13GSFGYY70 pKa = 10.62DD71 pKa = 3.03FGKK74 pKa = 10.04HH75 pKa = 4.31FRR77 pKa = 11.84ADD79 pKa = 3.08VSYY82 pKa = 10.3TNTISTIVTDD92 pKa = 3.91HH93 pKa = 5.37QAKK96 pKa = 9.78FGSIILNGYY105 pKa = 8.95IDD107 pKa = 5.95LPIEE111 pKa = 4.26DD112 pKa = 4.58TKK114 pKa = 9.44WTPFIGAGYY123 pKa = 10.63GSTNVDD129 pKa = 2.99AVNLCTAGGTDD140 pKa = 3.92DD141 pKa = 4.52CTDD144 pKa = 3.56DD145 pKa = 3.43VATYY149 pKa = 9.98SLSGGISYY157 pKa = 11.0ALNSDD162 pKa = 3.35TDD164 pKa = 3.45ITGKK168 pKa = 8.26ITYY171 pKa = 10.14LGFDD175 pKa = 4.71TINVTDD181 pKa = 5.18DD182 pKa = 3.47GTLVTVTEE190 pKa = 4.4SEE192 pKa = 4.39TLSAHH197 pKa = 6.27IGVKK201 pKa = 10.57FKK203 pKa = 11.03FF204 pKa = 3.66
MM1 pKa = 7.45SALKK5 pKa = 10.61SFAALSIASMSILPLTPEE23 pKa = 4.78LKK25 pKa = 10.59ADD27 pKa = 3.99DD28 pKa = 4.26YY29 pKa = 11.96EE30 pKa = 5.27KK31 pKa = 11.26GFYY34 pKa = 8.86GTIGAGAGTFSDD46 pKa = 4.33LLLVGTPFALAFDD59 pKa = 4.59PGFSYY64 pKa = 10.6EE65 pKa = 4.13GSFGYY70 pKa = 10.62DD71 pKa = 3.03FGKK74 pKa = 10.04HH75 pKa = 4.31FRR77 pKa = 11.84ADD79 pKa = 3.08VSYY82 pKa = 10.3TNTISTIVTDD92 pKa = 3.91HH93 pKa = 5.37QAKK96 pKa = 9.78FGSIILNGYY105 pKa = 8.95IDD107 pKa = 5.95LPIEE111 pKa = 4.26DD112 pKa = 4.58TKK114 pKa = 9.44WTPFIGAGYY123 pKa = 10.63GSTNVDD129 pKa = 2.99AVNLCTAGGTDD140 pKa = 3.92DD141 pKa = 4.52CTDD144 pKa = 3.56DD145 pKa = 3.43VATYY149 pKa = 9.98SLSGGISYY157 pKa = 11.0ALNSDD162 pKa = 3.35TDD164 pKa = 3.45ITGKK168 pKa = 8.26ITYY171 pKa = 10.14LGFDD175 pKa = 4.71TINVTDD181 pKa = 5.18DD182 pKa = 3.47GTLVTVTEE190 pKa = 4.4SEE192 pKa = 4.39TLSAHH197 pKa = 6.27IGVKK201 pKa = 10.57FKK203 pKa = 11.03FF204 pKa = 3.66
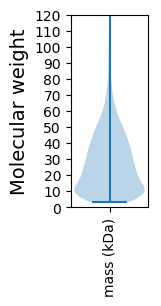
Molecular weight: 21.57 kDa
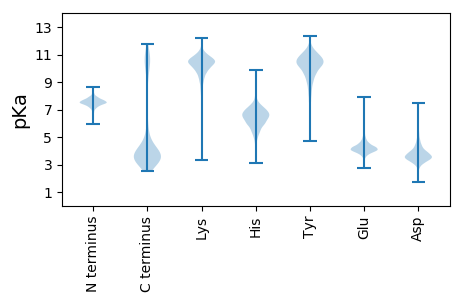
Isoelectric point according different methods:
Protein with the highest isoelectric point:
>tr|A3PE45|A3PE45_PROM0 Uncharacterized protein OS=Prochlorococcus marinus (strain MIT 9301) OX=167546 GN=P9301_13971 PE=4 SV=1
MM1 pKa = 7.41TKK3 pKa = 9.05RR4 pKa = 11.84TFGGTSRR11 pKa = 11.84KK12 pKa = 9.13RR13 pKa = 11.84KK14 pKa = 8.17RR15 pKa = 11.84VSGFRR20 pKa = 11.84VRR22 pKa = 11.84MRR24 pKa = 11.84SHH26 pKa = 6.25TGRR29 pKa = 11.84RR30 pKa = 11.84VIKK33 pKa = 10.15SRR35 pKa = 11.84RR36 pKa = 11.84QKK38 pKa = 9.67GRR40 pKa = 11.84EE41 pKa = 3.79RR42 pKa = 11.84IAVV45 pKa = 3.46
MM1 pKa = 7.41TKK3 pKa = 9.05RR4 pKa = 11.84TFGGTSRR11 pKa = 11.84KK12 pKa = 9.13RR13 pKa = 11.84KK14 pKa = 8.17RR15 pKa = 11.84VSGFRR20 pKa = 11.84VRR22 pKa = 11.84MRR24 pKa = 11.84SHH26 pKa = 6.25TGRR29 pKa = 11.84RR30 pKa = 11.84VIKK33 pKa = 10.15SRR35 pKa = 11.84RR36 pKa = 11.84QKK38 pKa = 9.67GRR40 pKa = 11.84EE41 pKa = 3.79RR42 pKa = 11.84IAVV45 pKa = 3.46
Molecular weight: 5.37 kDa
Isoelectric point according different methods:
Peptides (in silico digests for buttom-up proteomics)
Below you can find in silico digests of the whole proteome with Trypsin, Chymotrypsin, Trypsin+LysC, LysN, ArgC proteases suitable for different mass spec machines.| Try ESI |
 |
|---|
| ChTry ESI |
 |
|---|
| ArgC ESI |
 |
|---|
| LysN ESI |
 |
|---|
| TryLysC ESI |
 |
|---|
| Try MALDI |
 |
|---|
| ChTry MALDI |
 |
|---|
| ArgC MALDI |
 |
|---|
| LysN MALDI |
 |
|---|
| TryLysC MALDI |
 |
|---|
| Try LTQ |
 |
|---|
| ChTry LTQ |
 |
|---|
| ArgC LTQ |
 |
|---|
| LysN LTQ |
 |
|---|
| TryLysC LTQ |
 |
|---|
| Try MSlow |
 |
|---|
| ChTry MSlow |
 |
|---|
| ArgC MSlow |
 |
|---|
| LysN MSlow |
 |
|---|
| TryLysC MSlow |
 |
|---|
| Try MShigh |
 |
|---|
| ChTry MShigh |
 |
|---|
| ArgC MShigh |
 |
|---|
| LysN MShigh |
 |
|---|
| TryLysC MShigh |
 |
|---|
General Statistics
Number of major isoforms |
Number of additional isoforms |
Number of all proteins |
Number of amino acids |
Min. Seq. Length |
Max. Seq. Length |
Avg. Seq. Length |
Avg. Mol. Weight |
|---|---|---|---|---|---|---|---|
0 |
496198 |
29 |
1523 |
260.3 |
29.38 |
Amino acid frequency
Ala |
Cys |
Asp |
Glu |
Phe |
Gly |
His |
Ile |
Lys |
Leu |
|---|---|---|---|---|---|---|---|---|---|
5.401 ± 0.06 | 1.164 ± 0.022 |
5.128 ± 0.049 | 6.73 ± 0.057 |
4.955 ± 0.053 | 6.261 ± 0.055 |
1.498 ± 0.024 | 9.04 ± 0.065 |
8.605 ± 0.067 | 10.744 ± 0.075 |
Met |
Asn |
Gln |
Pro |
Arg |
Ser |
Thr |
Val |
Trp |
Tyr |
|---|---|---|---|---|---|---|---|---|---|
1.857 ± 0.025 | 6.494 ± 0.067 |
3.631 ± 0.03 | 3.035 ± 0.027 |
3.921 ± 0.04 | 7.732 ± 0.043 |
4.438 ± 0.036 | 5.27 ± 0.051 |
1.256 ± 0.026 | 2.838 ± 0.039 |
Most of the basic statistics you can see at this page can be downloaded from this CSV file
Proteome-pI is available under Creative Commons Attribution-NoDerivs license, for more details see here
| Reference: Kozlowski LP. Proteome-pI 2.0: Proteome Isoelectric Point Database Update. Nucleic Acids Res. 2021, doi: 10.1093/nar/gkab944 | Contact: Lukasz P. Kozlowski |
