Leptolinea tardivitalis
Taxonomy: cellular organisms; Bacteria; Terrabacteria group; Chloroflexi; Anaerolineae; Anaerolineales; Anaerolineaceae; Leptolinea
Average proteome isoelectric point is 6.28
Get precalculated fractions of proteins

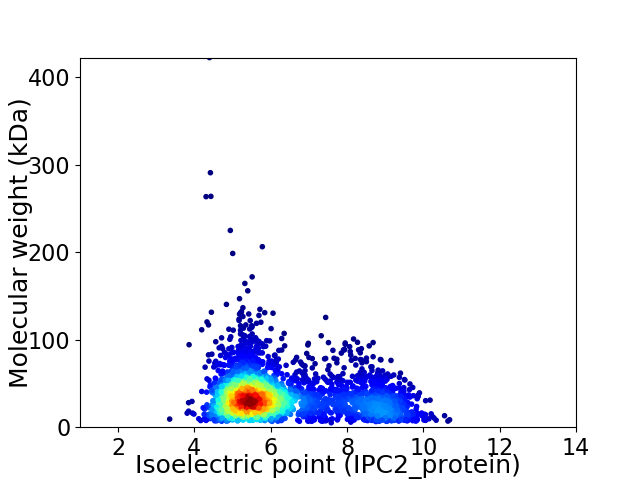
Virtual 2D-PAGE plot for 2936 proteins (isoelectric point calculated using IPC2_protein)
Get csv file with sequences according to given criteria:
* You can choose from 21 different methods for calculating isoelectric point
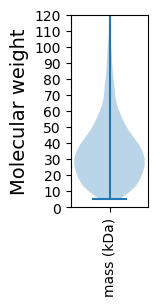
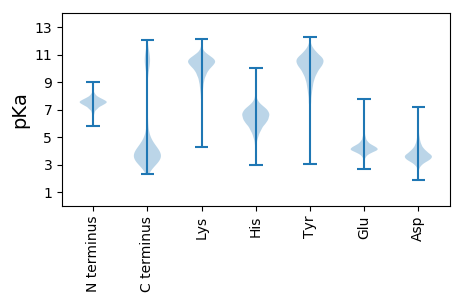
Summary statistics related to proteome-wise predictions


Protein with the lowest isoelectric point:
>tr|A0A0P6WZT5|A0A0P6WZT5_9CHLR Uncharacterized protein OS=Leptolinea tardivitalis OX=229920 GN=ADM99_02290 PE=4 SV=1
MM1 pKa = 7.52KK2 pKa = 10.38KK3 pKa = 9.83ADD5 pKa = 3.56FVIRR9 pKa = 11.84VLVLFSMIVSLLAGPGFIPASVVSAKK35 pKa = 10.36PSAQEE40 pKa = 4.38EE41 pKa = 4.86IPTTAPGNVPTDD53 pKa = 3.69EE54 pKa = 4.26PTATPTEE61 pKa = 4.29IPTEE65 pKa = 4.29VPTSVPTEE73 pKa = 4.12VPTEE77 pKa = 3.99EE78 pKa = 4.26PVIIPTDD85 pKa = 3.5IPTEE89 pKa = 4.2IPSPTPTVDD98 pKa = 2.96PSLIVTEE105 pKa = 4.91IPTATPTEE113 pKa = 4.52TVSVTPTITEE123 pKa = 4.38TPTEE127 pKa = 4.25TPEE130 pKa = 5.0SEE132 pKa = 4.19GQPFSHH138 pKa = 7.5LEE140 pKa = 3.65FAALDD145 pKa = 4.04DD146 pKa = 4.07GTPVEE151 pKa = 4.28EE152 pKa = 4.27LVIIGSPNPPEE163 pKa = 5.32GIDD166 pKa = 3.49RR167 pKa = 11.84PISAIAMTEE176 pKa = 4.06GEE178 pKa = 4.67TEE180 pKa = 4.19GLTNPLAVPAYY191 pKa = 8.66NWVYY195 pKa = 10.51GCSSVSAAMVAGFYY209 pKa = 10.91DD210 pKa = 3.34RR211 pKa = 11.84GGYY214 pKa = 8.66PNIYY218 pKa = 9.34TGPTDD223 pKa = 3.75GGVMPMNNSVWPTWTDD239 pKa = 2.97SSGDD243 pKa = 3.69TYY245 pKa = 11.62PNLPLAASKK254 pKa = 10.66QGGWTYY260 pKa = 10.71YY261 pKa = 10.06PWFHH265 pKa = 6.95
MM1 pKa = 7.52KK2 pKa = 10.38KK3 pKa = 9.83ADD5 pKa = 3.56FVIRR9 pKa = 11.84VLVLFSMIVSLLAGPGFIPASVVSAKK35 pKa = 10.36PSAQEE40 pKa = 4.38EE41 pKa = 4.86IPTTAPGNVPTDD53 pKa = 3.69EE54 pKa = 4.26PTATPTEE61 pKa = 4.29IPTEE65 pKa = 4.29VPTSVPTEE73 pKa = 4.12VPTEE77 pKa = 3.99EE78 pKa = 4.26PVIIPTDD85 pKa = 3.5IPTEE89 pKa = 4.2IPSPTPTVDD98 pKa = 2.96PSLIVTEE105 pKa = 4.91IPTATPTEE113 pKa = 4.52TVSVTPTITEE123 pKa = 4.38TPTEE127 pKa = 4.25TPEE130 pKa = 5.0SEE132 pKa = 4.19GQPFSHH138 pKa = 7.5LEE140 pKa = 3.65FAALDD145 pKa = 4.04DD146 pKa = 4.07GTPVEE151 pKa = 4.28EE152 pKa = 4.27LVIIGSPNPPEE163 pKa = 5.32GIDD166 pKa = 3.49RR167 pKa = 11.84PISAIAMTEE176 pKa = 4.06GEE178 pKa = 4.67TEE180 pKa = 4.19GLTNPLAVPAYY191 pKa = 8.66NWVYY195 pKa = 10.51GCSSVSAAMVAGFYY209 pKa = 10.91DD210 pKa = 3.34RR211 pKa = 11.84GGYY214 pKa = 8.66PNIYY218 pKa = 9.34TGPTDD223 pKa = 3.75GGVMPMNNSVWPTWTDD239 pKa = 2.97SSGDD243 pKa = 3.69TYY245 pKa = 11.62PNLPLAASKK254 pKa = 10.66QGGWTYY260 pKa = 10.71YY261 pKa = 10.06PWFHH265 pKa = 6.95
Molecular weight: 28.01 kDa
Isoelectric point according different methods:
Protein with the highest isoelectric point:
>tr|A0A0P6X7A0|A0A0P6X7A0_9CHLR Uncharacterized protein OS=Leptolinea tardivitalis OX=229920 GN=ADM99_11690 PE=4 SV=1
MM1 pKa = 7.62KK2 pKa = 10.19KK3 pKa = 9.77QAGQAKK9 pKa = 10.17SGLLDD14 pKa = 5.38LISTSPLIGRR24 pKa = 11.84VDD26 pKa = 3.35ANGIHH31 pKa = 6.37LTYY34 pKa = 9.47QTSTRR39 pKa = 11.84LRR41 pKa = 11.84LHH43 pKa = 6.84LPLPHH48 pKa = 7.04PNVSPLEE55 pKa = 4.26AGGARR60 pKa = 11.84LIDD63 pKa = 3.93HH64 pKa = 7.03RR65 pKa = 11.84HH66 pKa = 4.57NPYY69 pKa = 10.48RR70 pKa = 11.84LLPPCIGLRR79 pKa = 3.55
MM1 pKa = 7.62KK2 pKa = 10.19KK3 pKa = 9.77QAGQAKK9 pKa = 10.17SGLLDD14 pKa = 5.38LISTSPLIGRR24 pKa = 11.84VDD26 pKa = 3.35ANGIHH31 pKa = 6.37LTYY34 pKa = 9.47QTSTRR39 pKa = 11.84LRR41 pKa = 11.84LHH43 pKa = 6.84LPLPHH48 pKa = 7.04PNVSPLEE55 pKa = 4.26AGGARR60 pKa = 11.84LIDD63 pKa = 3.93HH64 pKa = 7.03RR65 pKa = 11.84HH66 pKa = 4.57NPYY69 pKa = 10.48RR70 pKa = 11.84LLPPCIGLRR79 pKa = 3.55
Molecular weight: 8.66 kDa
Isoelectric point according different methods:
Peptides (in silico digests for buttom-up proteomics)
Below you can find in silico digests of the whole proteome with Trypsin, Chymotrypsin, Trypsin+LysC, LysN, ArgC proteases suitable for different mass spec machines.| Try ESI |
 |
|---|
| ChTry ESI |
 |
|---|
| ArgC ESI |
 |
|---|
| LysN ESI |
 |
|---|
| TryLysC ESI |
 |
|---|
| Try MALDI |
 |
|---|
| ChTry MALDI |
 |
|---|
| ArgC MALDI |
 |
|---|
| LysN MALDI |
 |
|---|
| TryLysC MALDI |
 |
|---|
| Try LTQ |
 |
|---|
| ChTry LTQ |
 |
|---|
| ArgC LTQ |
 |
|---|
| LysN LTQ |
 |
|---|
| TryLysC LTQ |
 |
|---|
| Try MSlow |
 |
|---|
| ChTry MSlow |
 |
|---|
| ArgC MSlow |
 |
|---|
| LysN MSlow |
 |
|---|
| TryLysC MSlow |
 |
|---|
| Try MShigh |
 |
|---|
| ChTry MShigh |
 |
|---|
| ArgC MShigh |
 |
|---|
| LysN MShigh |
 |
|---|
| TryLysC MShigh |
 |
|---|
General Statistics
Number of major isoforms |
Number of additional isoforms |
Number of all proteins |
Number of amino acids |
Min. Seq. Length |
Max. Seq. Length |
Avg. Seq. Length |
Avg. Mol. Weight |
|---|---|---|---|---|---|---|---|
0 |
975580 |
48 |
3940 |
332.3 |
36.84 |
Amino acid frequency
Ala |
Cys |
Asp |
Glu |
Phe |
Gly |
His |
Ile |
Lys |
Leu |
|---|---|---|---|---|---|---|---|---|---|
8.252 ± 0.043 | 0.955 ± 0.015 |
5.214 ± 0.031 | 5.881 ± 0.052 |
4.273 ± 0.036 | 7.32 ± 0.043 |
1.871 ± 0.021 | 7.199 ± 0.044 |
4.764 ± 0.039 | 10.4 ± 0.06 |
Met |
Asn |
Gln |
Pro |
Arg |
Ser |
Thr |
Val |
Trp |
Tyr |
|---|---|---|---|---|---|---|---|---|---|
2.569 ± 0.02 | 3.994 ± 0.03 |
4.932 ± 0.031 | 3.676 ± 0.036 |
5.102 ± 0.04 | 6.438 ± 0.039 |
5.757 ± 0.053 | 6.946 ± 0.035 |
1.456 ± 0.024 | 3.001 ± 0.027 |
Most of the basic statistics you can see at this page can be downloaded from this CSV file
Proteome-pI is available under Creative Commons Attribution-NoDerivs license, for more details see here
| Reference: Kozlowski LP. Proteome-pI 2.0: Proteome Isoelectric Point Database Update. Nucleic Acids Res. 2021, doi: 10.1093/nar/gkab944 | Contact: Lukasz P. Kozlowski |
