Rhesus cytomegalovirus (strain 68-1) (RhCMV)
Taxonomy: Viruses; Duplodnaviria; Heunggongvirae; Peploviricota; Herviviricetes; Herpesvirales; Herpesviridae; Betaherpesvirinae; Cytomegalovirus; Macacine betaherpesvirus 3
Average proteome isoelectric point is 7.53
Get precalculated fractions of proteins

Virtual 2D-PAGE plot for 223 proteins (isoelectric point calculated using IPC2_protein)
Get csv file with sequences according to given criteria:
* You can choose from 21 different methods for calculating isoelectric point
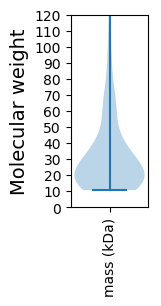
Summary statistics related to proteome-wise predictions


Protein with the lowest isoelectric point:
>tr|Q7TFW5|Q7TFW5_RHCM6 Rh16 OS=Rhesus cytomegalovirus (strain 68-1) OX=103930 PE=4 SV=1
MM1 pKa = 7.54FISGVLVQEE10 pKa = 4.42VVVVVYY16 pKa = 10.14EE17 pKa = 4.22LFLDD21 pKa = 3.92TFVDD25 pKa = 3.48SFDD28 pKa = 3.55NVFVYY33 pKa = 10.0DD34 pKa = 3.51VRR36 pKa = 11.84VTSEE40 pKa = 4.03VQDD43 pKa = 3.88AFCDD47 pKa = 3.91VYY49 pKa = 11.63EE50 pKa = 4.16MLVTVLDD57 pKa = 3.37IGVVVFPCEE66 pKa = 4.07VLADD70 pKa = 4.18PYY72 pKa = 11.21VVVHH76 pKa = 6.07VVLLIYY82 pKa = 10.38EE83 pKa = 4.44LFVDD87 pKa = 4.12LGVVEE92 pKa = 4.84SVVNSVVILTLDD104 pKa = 3.39EE105 pKa = 4.87LFVEE109 pKa = 4.87LSVARR114 pKa = 11.84IGQNMTKK121 pKa = 10.61
MM1 pKa = 7.54FISGVLVQEE10 pKa = 4.42VVVVVYY16 pKa = 10.14EE17 pKa = 4.22LFLDD21 pKa = 3.92TFVDD25 pKa = 3.48SFDD28 pKa = 3.55NVFVYY33 pKa = 10.0DD34 pKa = 3.51VRR36 pKa = 11.84VTSEE40 pKa = 4.03VQDD43 pKa = 3.88AFCDD47 pKa = 3.91VYY49 pKa = 11.63EE50 pKa = 4.16MLVTVLDD57 pKa = 3.37IGVVVFPCEE66 pKa = 4.07VLADD70 pKa = 4.18PYY72 pKa = 11.21VVVHH76 pKa = 6.07VVLLIYY82 pKa = 10.38EE83 pKa = 4.44LFVDD87 pKa = 4.12LGVVEE92 pKa = 4.84SVVNSVVILTLDD104 pKa = 3.39EE105 pKa = 4.87LFVEE109 pKa = 4.87LSVARR114 pKa = 11.84IGQNMTKK121 pKa = 10.61
Molecular weight: 13.56 kDa
Isoelectric point according different methods:
Protein with the highest isoelectric point:
>tr|Q7TFS9|Q7TFS9_RHCM6 Rh52 OS=Rhesus cytomegalovirus (strain 68-1) OX=103930 PE=4 SV=1
MM1 pKa = 8.27KK2 pKa = 10.46MMMTTMKK9 pKa = 9.62RR10 pKa = 11.84QRR12 pKa = 11.84WMVMRR17 pKa = 11.84AWATPPRR24 pKa = 11.84PMIGLRR30 pKa = 11.84GRR32 pKa = 11.84HH33 pKa = 4.89LLGRR37 pKa = 11.84TSCYY41 pKa = 9.87LYY43 pKa = 10.42KK44 pKa = 10.33IKK46 pKa = 10.56FQITGSFPTCKK57 pKa = 9.65RR58 pKa = 11.84RR59 pKa = 11.84SKK61 pKa = 10.79AVSTAARR68 pKa = 11.84SVQWVYY74 pKa = 9.47FWEE77 pKa = 4.35MRR79 pKa = 11.84VRR81 pKa = 11.84WCLKK85 pKa = 9.41PQLDD89 pKa = 3.66MDD91 pKa = 4.93GIEE94 pKa = 4.65AFCEE98 pKa = 4.82FYY100 pKa = 10.16STLSIRR106 pKa = 11.84DD107 pKa = 3.11QDD109 pKa = 3.77DD110 pKa = 3.59FNRR113 pKa = 11.84EE114 pKa = 3.31VDD116 pKa = 3.51LGVQHH121 pKa = 7.28RR122 pKa = 11.84RR123 pKa = 11.84LQQLRR128 pKa = 11.84RR129 pKa = 11.84ARR131 pKa = 11.84QNLKK135 pKa = 10.39RR136 pKa = 11.84EE137 pKa = 4.62CICSGGG143 pKa = 3.42
MM1 pKa = 8.27KK2 pKa = 10.46MMMTTMKK9 pKa = 9.62RR10 pKa = 11.84QRR12 pKa = 11.84WMVMRR17 pKa = 11.84AWATPPRR24 pKa = 11.84PMIGLRR30 pKa = 11.84GRR32 pKa = 11.84HH33 pKa = 4.89LLGRR37 pKa = 11.84TSCYY41 pKa = 9.87LYY43 pKa = 10.42KK44 pKa = 10.33IKK46 pKa = 10.56FQITGSFPTCKK57 pKa = 9.65RR58 pKa = 11.84RR59 pKa = 11.84SKK61 pKa = 10.79AVSTAARR68 pKa = 11.84SVQWVYY74 pKa = 9.47FWEE77 pKa = 4.35MRR79 pKa = 11.84VRR81 pKa = 11.84WCLKK85 pKa = 9.41PQLDD89 pKa = 3.66MDD91 pKa = 4.93GIEE94 pKa = 4.65AFCEE98 pKa = 4.82FYY100 pKa = 10.16STLSIRR106 pKa = 11.84DD107 pKa = 3.11QDD109 pKa = 3.77DD110 pKa = 3.59FNRR113 pKa = 11.84EE114 pKa = 3.31VDD116 pKa = 3.51LGVQHH121 pKa = 7.28RR122 pKa = 11.84RR123 pKa = 11.84LQQLRR128 pKa = 11.84RR129 pKa = 11.84ARR131 pKa = 11.84QNLKK135 pKa = 10.39RR136 pKa = 11.84EE137 pKa = 4.62CICSGGG143 pKa = 3.42
Molecular weight: 17.12 kDa
Isoelectric point according different methods:
Peptides (in silico digests for buttom-up proteomics)
Below you can find in silico digests of the whole proteome with Trypsin, Chymotrypsin, Trypsin+LysC, LysN, ArgC proteases suitable for different mass spec machines.| Try ESI |
 |
|---|
| ChTry ESI |
 |
|---|
| ArgC ESI |
 |
|---|
| LysN ESI |
 |
|---|
| TryLysC ESI |
 |
|---|
| Try MALDI |
 |
|---|
| ChTry MALDI |
 |
|---|
| ArgC MALDI |
 |
|---|
| LysN MALDI |
 |
|---|
| TryLysC MALDI |
 |
|---|
| Try LTQ |
 |
|---|
| ChTry LTQ |
 |
|---|
| ArgC LTQ |
 |
|---|
| LysN LTQ |
 |
|---|
| TryLysC LTQ |
 |
|---|
| Try MSlow |
 |
|---|
| ChTry MSlow |
 |
|---|
| ArgC MSlow |
 |
|---|
| LysN MSlow |
 |
|---|
| TryLysC MSlow |
 |
|---|
| Try MShigh |
 |
|---|
| ChTry MShigh |
 |
|---|
| ArgC MShigh |
 |
|---|
| LysN MShigh |
 |
|---|
| TryLysC MShigh |
 |
|---|
General Statistics
Number of major isoforms |
Number of additional isoforms |
Number of all proteins |
Number of amino acids |
Min. Seq. Length |
Max. Seq. Length |
Avg. Seq. Length |
Avg. Mol. Weight |
|---|---|---|---|---|---|---|---|
0 |
66627 |
100 |
2177 |
298.8 |
33.8 |
Amino acid frequency
Ala |
Cys |
Asp |
Glu |
Phe |
Gly |
His |
Ile |
Lys |
Leu |
|---|---|---|---|---|---|---|---|---|---|
6.64 ± 0.179 | 2.675 ± 0.095 |
4.479 ± 0.137 | 4.824 ± 0.133 |
4.171 ± 0.124 | 4.84 ± 0.12 |
3.284 ± 0.104 | 5.094 ± 0.13 |
3.584 ± 0.136 | 9.886 ± 0.193 |
Met |
Asn |
Gln |
Pro |
Arg |
Ser |
Thr |
Val |
Trp |
Tyr |
|---|---|---|---|---|---|---|---|---|---|
2.534 ± 0.077 | 4.127 ± 0.119 |
5.654 ± 0.194 | 3.904 ± 0.137 |
7.009 ± 0.202 | 7.967 ± 0.17 |
7.213 ± 0.26 | 7.114 ± 0.158 |
1.483 ± 0.092 | 3.518 ± 0.097 |
Most of the basic statistics you can see at this page can be downloaded from this CSV file
Proteome-pI is available under Creative Commons Attribution-NoDerivs license, for more details see here
| Reference: Kozlowski LP. Proteome-pI 2.0: Proteome Isoelectric Point Database Update. Nucleic Acids Res. 2021, doi: 10.1093/nar/gkab944 | Contact: Lukasz P. Kozlowski |
