Vibrio phage VspDsh_1
Taxonomy: Viruses; Duplodnaviria; Heunggongvirae; Uroviricota; Caudoviricetes; Caudovirales; Siphoviridae; unclassified Siphoviridae
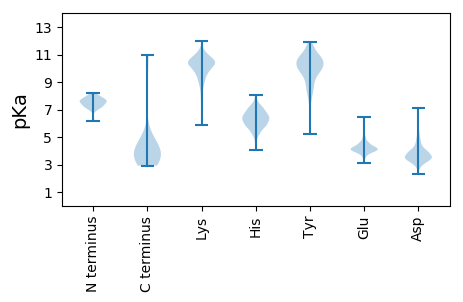
Average proteome isoelectric point is 6.6
Get precalculated fractions of proteins

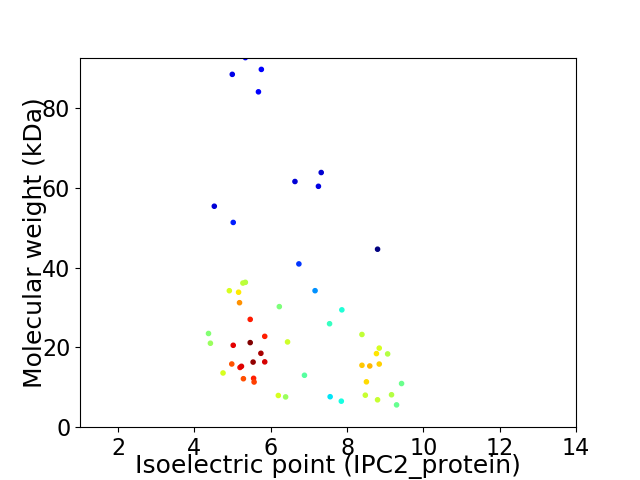
Virtual 2D-PAGE plot for 55 proteins (isoelectric point calculated using IPC2_protein)
Get csv file with sequences according to given criteria:
* You can choose from 21 different methods for calculating isoelectric point
Summary statistics related to proteome-wise predictions


Protein with the lowest isoelectric point:
>tr|A0A411BK75|A0A411BK75_9CAUD Uncharacterized protein OS=Vibrio phage VspDsh_1 OX=2484248 GN=VspDsh1_18 PE=4 SV=1
MM1 pKa = 6.23TTAAFDD7 pKa = 3.93GKK9 pKa = 10.9LFATDD14 pKa = 3.6KK15 pKa = 10.96QVTSNNHH22 pKa = 4.93ASDD25 pKa = 3.48RR26 pKa = 11.84FARR29 pKa = 11.84KK30 pKa = 9.6LYY32 pKa = 9.77FYY34 pKa = 10.07PDD36 pKa = 3.47YY37 pKa = 11.55GLVLTVAGNAPSFIEE52 pKa = 4.2VVDD55 pKa = 3.69WAVGEE60 pKa = 4.18IATEE64 pKa = 4.04QRR66 pKa = 11.84FSVPDD71 pKa = 3.47GDD73 pKa = 4.07FTVLAVRR80 pKa = 11.84VTPGLPNMIYY90 pKa = 9.92TGFRR94 pKa = 11.84GPDD97 pKa = 3.36NQCGHH102 pKa = 6.05MEE104 pKa = 3.98RR105 pKa = 11.84EE106 pKa = 4.2YY107 pKa = 11.08EE108 pKa = 3.93KK109 pKa = 10.21RR110 pKa = 11.84TAIGSGGQFALGAMAMKK127 pKa = 10.28GSAVEE132 pKa = 4.56AIEE135 pKa = 3.93IAMDD139 pKa = 4.11LDD141 pKa = 4.47VYY143 pKa = 10.69TGGGIDD149 pKa = 3.56WFDD152 pKa = 4.48TITMEE157 pKa = 4.93HH158 pKa = 6.27SADD161 pKa = 3.57VIRR164 pKa = 11.84RR165 pKa = 11.84TLKK168 pKa = 9.78TDD170 pKa = 2.58WPTWVPPMSEE180 pKa = 4.12PEE182 pKa = 4.0APEE185 pKa = 4.06NPEE188 pKa = 4.58DD189 pKa = 3.9EE190 pKa = 4.44QQ191 pKa = 5.0
MM1 pKa = 6.23TTAAFDD7 pKa = 3.93GKK9 pKa = 10.9LFATDD14 pKa = 3.6KK15 pKa = 10.96QVTSNNHH22 pKa = 4.93ASDD25 pKa = 3.48RR26 pKa = 11.84FARR29 pKa = 11.84KK30 pKa = 9.6LYY32 pKa = 9.77FYY34 pKa = 10.07PDD36 pKa = 3.47YY37 pKa = 11.55GLVLTVAGNAPSFIEE52 pKa = 4.2VVDD55 pKa = 3.69WAVGEE60 pKa = 4.18IATEE64 pKa = 4.04QRR66 pKa = 11.84FSVPDD71 pKa = 3.47GDD73 pKa = 4.07FTVLAVRR80 pKa = 11.84VTPGLPNMIYY90 pKa = 9.92TGFRR94 pKa = 11.84GPDD97 pKa = 3.36NQCGHH102 pKa = 6.05MEE104 pKa = 3.98RR105 pKa = 11.84EE106 pKa = 4.2YY107 pKa = 11.08EE108 pKa = 3.93KK109 pKa = 10.21RR110 pKa = 11.84TAIGSGGQFALGAMAMKK127 pKa = 10.28GSAVEE132 pKa = 4.56AIEE135 pKa = 3.93IAMDD139 pKa = 4.11LDD141 pKa = 4.47VYY143 pKa = 10.69TGGGIDD149 pKa = 3.56WFDD152 pKa = 4.48TITMEE157 pKa = 4.93HH158 pKa = 6.27SADD161 pKa = 3.57VIRR164 pKa = 11.84RR165 pKa = 11.84TLKK168 pKa = 9.78TDD170 pKa = 2.58WPTWVPPMSEE180 pKa = 4.12PEE182 pKa = 4.0APEE185 pKa = 4.06NPEE188 pKa = 4.58DD189 pKa = 3.9EE190 pKa = 4.44QQ191 pKa = 5.0
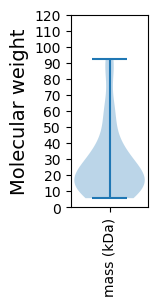
Molecular weight: 21.04 kDa
Isoelectric point according different methods:
Protein with the highest isoelectric point:
>tr|A0A411BKB5|A0A411BKB5_9CAUD Uncharacterized protein OS=Vibrio phage VspDsh_1 OX=2484248 GN=VspDsh1_50 PE=4 SV=1
MM1 pKa = 7.68AKK3 pKa = 9.83LASHH7 pKa = 6.32ITVDD11 pKa = 3.32GVTYY15 pKa = 10.43SVSRR19 pKa = 11.84SKK21 pKa = 10.78FGYY24 pKa = 9.22YY25 pKa = 8.38ATKK28 pKa = 10.15NGQRR32 pKa = 11.84VTGNFKK38 pKa = 10.91NLDD41 pKa = 4.01LLEE44 pKa = 4.59KK45 pKa = 10.6ALEE48 pKa = 4.08RR49 pKa = 11.84LL50 pKa = 3.71
MM1 pKa = 7.68AKK3 pKa = 9.83LASHH7 pKa = 6.32ITVDD11 pKa = 3.32GVTYY15 pKa = 10.43SVSRR19 pKa = 11.84SKK21 pKa = 10.78FGYY24 pKa = 9.22YY25 pKa = 8.38ATKK28 pKa = 10.15NGQRR32 pKa = 11.84VTGNFKK38 pKa = 10.91NLDD41 pKa = 4.01LLEE44 pKa = 4.59KK45 pKa = 10.6ALEE48 pKa = 4.08RR49 pKa = 11.84LL50 pKa = 3.71
Molecular weight: 5.59 kDa
Isoelectric point according different methods:
Peptides (in silico digests for buttom-up proteomics)
Below you can find in silico digests of the whole proteome with Trypsin, Chymotrypsin, Trypsin+LysC, LysN, ArgC proteases suitable for different mass spec machines.| Try ESI |
 |
|---|
| ChTry ESI |
 |
|---|
| ArgC ESI |
 |
|---|
| LysN ESI |
 |
|---|
| TryLysC ESI |
 |
|---|
| Try MALDI |
 |
|---|
| ChTry MALDI |
 |
|---|
| ArgC MALDI |
 |
|---|
| LysN MALDI |
 |
|---|
| TryLysC MALDI |
 |
|---|
| Try LTQ |
 |
|---|
| ChTry LTQ |
 |
|---|
| ArgC LTQ |
 |
|---|
| LysN LTQ |
 |
|---|
| TryLysC LTQ |
 |
|---|
| Try MSlow |
 |
|---|
| ChTry MSlow |
 |
|---|
| ArgC MSlow |
 |
|---|
| LysN MSlow |
 |
|---|
| TryLysC MSlow |
 |
|---|
| Try MShigh |
 |
|---|
| ChTry MShigh |
 |
|---|
| ArgC MShigh |
 |
|---|
| LysN MShigh |
 |
|---|
| TryLysC MShigh |
 |
|---|
General Statistics
Number of major isoforms |
Number of additional isoforms |
Number of all proteins |
Number of amino acids |
Min. Seq. Length |
Max. Seq. Length |
Avg. Seq. Length |
Avg. Mol. Weight |
|---|---|---|---|---|---|---|---|
0 |
13855 |
50 |
842 |
251.9 |
28.15 |
Amino acid frequency
Ala |
Cys |
Asp |
Glu |
Phe |
Gly |
His |
Ile |
Lys |
Leu |
|---|---|---|---|---|---|---|---|---|---|
8.495 ± 0.608 | 1.306 ± 0.168 |
5.789 ± 0.237 | 6.734 ± 0.36 |
3.717 ± 0.183 | 7.571 ± 0.278 |
2.158 ± 0.237 | 5.204 ± 0.174 |
6.164 ± 0.35 | 7.578 ± 0.262 |
Met |
Asn |
Gln |
Pro |
Arg |
Ser |
Thr |
Val |
Trp |
Tyr |
|---|---|---|---|---|---|---|---|---|---|
2.952 ± 0.161 | 4.619 ± 0.179 |
4.157 ± 0.238 | 4.345 ± 0.522 |
5.327 ± 0.224 | 5.428 ± 0.236 |
6.453 ± 0.346 | 6.979 ± 0.298 |
1.624 ± 0.154 | 3.399 ± 0.189 |
Most of the basic statistics you can see at this page can be downloaded from this CSV file
Proteome-pI is available under Creative Commons Attribution-NoDerivs license, for more details see here
| Reference: Kozlowski LP. Proteome-pI 2.0: Proteome Isoelectric Point Database Update. Nucleic Acids Res. 2021, doi: 10.1093/nar/gkab944 | Contact: Lukasz P. Kozlowski |
