Streptococcus phage Javan638
Taxonomy: Viruses; Duplodnaviria; Heunggongvirae; Uroviricota; Caudoviricetes; Caudovirales; Siphoviridae; unclassified Siphoviridae
Average proteome isoelectric point is 6.05
Get precalculated fractions of proteins

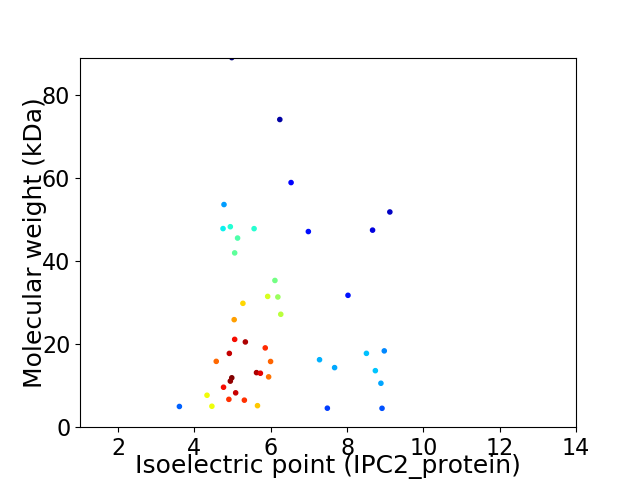
Virtual 2D-PAGE plot for 46 proteins (isoelectric point calculated using IPC2_protein)
Get csv file with sequences according to given criteria:
* You can choose from 21 different methods for calculating isoelectric point
Summary statistics related to proteome-wise predictions


Protein with the lowest isoelectric point:
>tr|A0A4D6BGW7|A0A4D6BGW7_9CAUD Major capsid protein OS=Streptococcus phage Javan638 OX=2548293 GN=Javan638_0030 PE=4 SV=1
MM1 pKa = 7.62TLTFLDD7 pKa = 4.78FFAGVGCFRR16 pKa = 11.84RR17 pKa = 11.84GLKK20 pKa = 10.2LAGITCFGYY29 pKa = 10.85YY30 pKa = 9.66VDD32 pKa = 5.54EE33 pKa = 4.58IQTGIDD39 pKa = 2.95KK40 pKa = 11.1GQFTDD45 pKa = 3.83MEE47 pKa = 4.43VTYY50 pKa = 9.25ITEE53 pKa = 4.23DD54 pKa = 3.44TNQLWEE60 pKa = 4.45EE61 pKa = 4.15VAPTLSKK68 pKa = 11.17
MM1 pKa = 7.62TLTFLDD7 pKa = 4.78FFAGVGCFRR16 pKa = 11.84RR17 pKa = 11.84GLKK20 pKa = 10.2LAGITCFGYY29 pKa = 10.85YY30 pKa = 9.66VDD32 pKa = 5.54EE33 pKa = 4.58IQTGIDD39 pKa = 2.95KK40 pKa = 11.1GQFTDD45 pKa = 3.83MEE47 pKa = 4.43VTYY50 pKa = 9.25ITEE53 pKa = 4.23DD54 pKa = 3.44TNQLWEE60 pKa = 4.45EE61 pKa = 4.15VAPTLSKK68 pKa = 11.17
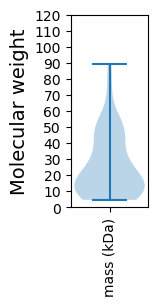
Molecular weight: 7.7 kDa
Isoelectric point according different methods:
Protein with the highest isoelectric point:
>tr|A0A4D6BCG3|A0A4D6BCG3_9CAUD Portal protein OS=Streptococcus phage Javan638 OX=2548293 GN=Javan638_0028 PE=4 SV=1
MM1 pKa = 7.78NDD3 pKa = 2.94NQRR6 pKa = 11.84RR7 pKa = 11.84GIWKK11 pKa = 9.4LRR13 pKa = 11.84RR14 pKa = 11.84DD15 pKa = 3.63GFGYY19 pKa = 10.46GAIAQMLNLSLGSVKK34 pKa = 10.25QYY36 pKa = 10.58CRR38 pKa = 11.84RR39 pKa = 11.84HH40 pKa = 5.73LEE42 pKa = 4.13LKK44 pKa = 10.93GMGQFVKK51 pKa = 10.78YY52 pKa = 10.3QLDD55 pKa = 3.54EE56 pKa = 4.48GEE58 pKa = 5.04RR59 pKa = 11.84PYY61 pKa = 11.22CKK63 pKa = 10.36NCMKK67 pKa = 10.41KK68 pKa = 9.81LHH70 pKa = 6.69HH71 pKa = 6.58AVQGRR76 pKa = 11.84PKK78 pKa = 9.96KK79 pKa = 10.34FCSNSCRR86 pKa = 11.84AIWWRR91 pKa = 11.84NHH93 pKa = 5.09QSQHH97 pKa = 6.41DD98 pKa = 4.05KK99 pKa = 11.04TKK101 pKa = 9.57TAYY104 pKa = 10.17DD105 pKa = 3.63EE106 pKa = 4.54LTCQNCGRR114 pKa = 11.84SFLSYY119 pKa = 11.22ANPTRR124 pKa = 11.84KK125 pKa = 9.4FCGHH129 pKa = 6.83PCYY132 pKa = 10.56VEE134 pKa = 3.41YY135 pKa = 10.67RR136 pKa = 11.84FRR138 pKa = 11.84KK139 pKa = 9.81GVTNDD144 pKa = 2.98NATQDD149 pKa = 3.13GDD151 pKa = 3.74YY152 pKa = 10.38GTFSKK157 pKa = 11.14
MM1 pKa = 7.78NDD3 pKa = 2.94NQRR6 pKa = 11.84RR7 pKa = 11.84GIWKK11 pKa = 9.4LRR13 pKa = 11.84RR14 pKa = 11.84DD15 pKa = 3.63GFGYY19 pKa = 10.46GAIAQMLNLSLGSVKK34 pKa = 10.25QYY36 pKa = 10.58CRR38 pKa = 11.84RR39 pKa = 11.84HH40 pKa = 5.73LEE42 pKa = 4.13LKK44 pKa = 10.93GMGQFVKK51 pKa = 10.78YY52 pKa = 10.3QLDD55 pKa = 3.54EE56 pKa = 4.48GEE58 pKa = 5.04RR59 pKa = 11.84PYY61 pKa = 11.22CKK63 pKa = 10.36NCMKK67 pKa = 10.41KK68 pKa = 9.81LHH70 pKa = 6.69HH71 pKa = 6.58AVQGRR76 pKa = 11.84PKK78 pKa = 9.96KK79 pKa = 10.34FCSNSCRR86 pKa = 11.84AIWWRR91 pKa = 11.84NHH93 pKa = 5.09QSQHH97 pKa = 6.41DD98 pKa = 4.05KK99 pKa = 11.04TKK101 pKa = 9.57TAYY104 pKa = 10.17DD105 pKa = 3.63EE106 pKa = 4.54LTCQNCGRR114 pKa = 11.84SFLSYY119 pKa = 11.22ANPTRR124 pKa = 11.84KK125 pKa = 9.4FCGHH129 pKa = 6.83PCYY132 pKa = 10.56VEE134 pKa = 3.41YY135 pKa = 10.67RR136 pKa = 11.84FRR138 pKa = 11.84KK139 pKa = 9.81GVTNDD144 pKa = 2.98NATQDD149 pKa = 3.13GDD151 pKa = 3.74YY152 pKa = 10.38GTFSKK157 pKa = 11.14
Molecular weight: 18.38 kDa
Isoelectric point according different methods:
Peptides (in silico digests for buttom-up proteomics)
Below you can find in silico digests of the whole proteome with Trypsin, Chymotrypsin, Trypsin+LysC, LysN, ArgC proteases suitable for different mass spec machines.| Try ESI |
 |
|---|
| ChTry ESI |
 |
|---|
| ArgC ESI |
 |
|---|
| LysN ESI |
 |
|---|
| TryLysC ESI |
 |
|---|
| Try MALDI |
 |
|---|
| ChTry MALDI |
 |
|---|
| ArgC MALDI |
 |
|---|
| LysN MALDI |
 |
|---|
| TryLysC MALDI |
 |
|---|
| Try LTQ |
 |
|---|
| ChTry LTQ |
 |
|---|
| ArgC LTQ |
 |
|---|
| LysN LTQ |
 |
|---|
| TryLysC LTQ |
 |
|---|
| Try MSlow |
 |
|---|
| ChTry MSlow |
 |
|---|
| ArgC MSlow |
 |
|---|
| LysN MSlow |
 |
|---|
| TryLysC MSlow |
 |
|---|
| Try MShigh |
 |
|---|
| ChTry MShigh |
 |
|---|
| ArgC MShigh |
 |
|---|
| LysN MShigh |
 |
|---|
| TryLysC MShigh |
 |
|---|
General Statistics
Number of major isoforms |
Number of additional isoforms |
Number of all proteins |
Number of amino acids |
Min. Seq. Length |
Max. Seq. Length |
Avg. Seq. Length |
Avg. Mol. Weight |
|---|---|---|---|---|---|---|---|
0 |
10598 |
41 |
832 |
230.4 |
25.91 |
Amino acid frequency
Ala |
Cys |
Asp |
Glu |
Phe |
Gly |
His |
Ile |
Lys |
Leu |
|---|---|---|---|---|---|---|---|---|---|
7.077 ± 0.353 | 0.878 ± 0.123 |
6.001 ± 0.408 | 7.077 ± 0.344 |
3.803 ± 0.188 | 6.964 ± 0.327 |
2.029 ± 0.143 | 5.85 ± 0.264 |
7.143 ± 0.199 | 9.181 ± 0.286 |
Met |
Asn |
Gln |
Pro |
Arg |
Ser |
Thr |
Val |
Trp |
Tyr |
|---|---|---|---|---|---|---|---|---|---|
2.434 ± 0.148 | 4.595 ± 0.218 |
2.925 ± 0.209 | 4.303 ± 0.244 |
4.388 ± 0.292 | 6.643 ± 0.413 |
6.813 ± 0.367 | 6.539 ± 0.263 |
1.51 ± 0.117 | 3.85 ± 0.234 |
Most of the basic statistics you can see at this page can be downloaded from this CSV file
Proteome-pI is available under Creative Commons Attribution-NoDerivs license, for more details see here
| Reference: Kozlowski LP. Proteome-pI 2.0: Proteome Isoelectric Point Database Update. Nucleic Acids Res. 2021, doi: 10.1093/nar/gkab944 | Contact: Lukasz P. Kozlowski |
