Port-miou virus
Taxonomy: Viruses; Varidnaviria; Bamfordvirae; Nucleocytoviricota; Megaviricetes; Pimascovirales; Marseilleviridae; Lausannevirus
Average proteome isoelectric point is 6.93
Get precalculated fractions of proteins

Virtual 2D-PAGE plot for 410 proteins (isoelectric point calculated using IPC2_protein)
Get csv file with sequences according to given criteria:
* You can choose from 21 different methods for calculating isoelectric point
Summary statistics related to proteome-wise predictions


Protein with the lowest isoelectric point:
>tr|A0A0N9PVH4|A0A0N9PVH4_9VIRU Uncharacterized protein OS=Port-miou virus OX=1733873 GN=PMV_149 PE=4 SV=1
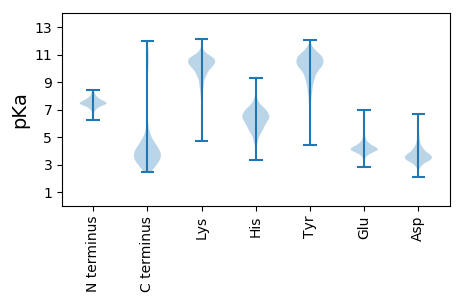
MM1 pKa = 7.49SRR3 pKa = 11.84LQGFFKK9 pKa = 10.51DD10 pKa = 3.47IPIVGSYY17 pKa = 10.37SALPPVLPRR26 pKa = 11.84GSLVFLTSDD35 pKa = 3.11EE36 pKa = 4.21TLYY39 pKa = 11.38VSDD42 pKa = 3.59GTTWNATGGDD52 pKa = 3.95IGPLAAQVAQNTADD66 pKa = 3.22IGVLQTQVGTLQGEE80 pKa = 4.73VATNTLDD87 pKa = 3.32IGTLQTQVSTNTSDD101 pKa = 3.09IGTLQTQVAGNSTNISALQTDD122 pKa = 4.12VATLEE127 pKa = 4.4GQVATNTTDD136 pKa = 2.67IGTLQSQVATNTTNIQQNSDD156 pKa = 4.12SITALLINQSQGFSILDD173 pKa = 3.48NTQTRR178 pKa = 11.84AYY180 pKa = 6.68TQPISRR186 pKa = 11.84VDD188 pKa = 3.54VASVSPTVIYY198 pKa = 10.0TLGIPLAININAVYY212 pKa = 10.13LIQWNVLAHH221 pKa = 6.05YY222 pKa = 7.5EE223 pKa = 4.06TANVYY228 pKa = 9.77FAVGQSSVLSNGVGSLVSVFGTTTNQTNNSGAANIAVTADD268 pKa = 3.8FSTPNFRR275 pKa = 11.84LIVTSDD281 pKa = 3.24SAVNTTYY288 pKa = 10.59SGYY291 pKa = 11.11VIVTNILNIVPP302 pKa = 4.08
MM1 pKa = 7.49SRR3 pKa = 11.84LQGFFKK9 pKa = 10.51DD10 pKa = 3.47IPIVGSYY17 pKa = 10.37SALPPVLPRR26 pKa = 11.84GSLVFLTSDD35 pKa = 3.11EE36 pKa = 4.21TLYY39 pKa = 11.38VSDD42 pKa = 3.59GTTWNATGGDD52 pKa = 3.95IGPLAAQVAQNTADD66 pKa = 3.22IGVLQTQVGTLQGEE80 pKa = 4.73VATNTLDD87 pKa = 3.32IGTLQTQVSTNTSDD101 pKa = 3.09IGTLQTQVAGNSTNISALQTDD122 pKa = 4.12VATLEE127 pKa = 4.4GQVATNTTDD136 pKa = 2.67IGTLQSQVATNTTNIQQNSDD156 pKa = 4.12SITALLINQSQGFSILDD173 pKa = 3.48NTQTRR178 pKa = 11.84AYY180 pKa = 6.68TQPISRR186 pKa = 11.84VDD188 pKa = 3.54VASVSPTVIYY198 pKa = 10.0TLGIPLAININAVYY212 pKa = 10.13LIQWNVLAHH221 pKa = 6.05YY222 pKa = 7.5EE223 pKa = 4.06TANVYY228 pKa = 9.77FAVGQSSVLSNGVGSLVSVFGTTTNQTNNSGAANIAVTADD268 pKa = 3.8FSTPNFRR275 pKa = 11.84LIVTSDD281 pKa = 3.24SAVNTTYY288 pKa = 10.59SGYY291 pKa = 11.11VIVTNILNIVPP302 pKa = 4.08
Molecular weight: 31.61 kDa
Isoelectric point according different methods:
Protein with the highest isoelectric point:
>tr|A0A0N9PZE7|A0A0N9PZE7_9VIRU Uncharacterized protein OS=Port-miou virus OX=1733873 GN=PMV_395 PE=4 SV=1
MM1 pKa = 6.64QQRR4 pKa = 11.84LVNPEE9 pKa = 3.48TGRR12 pKa = 11.84NVLYY16 pKa = 10.64GGKK19 pKa = 7.33THH21 pKa = 7.11LNLVRR26 pKa = 11.84RR27 pKa = 11.84GILPRR32 pKa = 11.84EE33 pKa = 4.01EE34 pKa = 4.1PVKK37 pKa = 10.77KK38 pKa = 10.43GAGGSNVRR46 pKa = 11.84KK47 pKa = 9.73YY48 pKa = 10.73KK49 pKa = 10.37KK50 pKa = 9.1EE51 pKa = 3.7HH52 pKa = 6.04LKK54 pKa = 10.93ASEE57 pKa = 4.21FCGTVPGSFPVNTEE71 pKa = 3.4RR72 pKa = 11.84RR73 pKa = 11.84AKK75 pKa = 10.48AALSYY80 pKa = 10.95ARR82 pKa = 11.84NDD84 pKa = 3.41VNPEE88 pKa = 3.76RR89 pKa = 11.84VRR91 pKa = 11.84EE92 pKa = 4.01CARR95 pKa = 11.84RR96 pKa = 11.84KK97 pKa = 8.83AKK99 pKa = 10.52RR100 pKa = 11.84MGWFF104 pKa = 3.21
MM1 pKa = 6.64QQRR4 pKa = 11.84LVNPEE9 pKa = 3.48TGRR12 pKa = 11.84NVLYY16 pKa = 10.64GGKK19 pKa = 7.33THH21 pKa = 7.11LNLVRR26 pKa = 11.84RR27 pKa = 11.84GILPRR32 pKa = 11.84EE33 pKa = 4.01EE34 pKa = 4.1PVKK37 pKa = 10.77KK38 pKa = 10.43GAGGSNVRR46 pKa = 11.84KK47 pKa = 9.73YY48 pKa = 10.73KK49 pKa = 10.37KK50 pKa = 9.1EE51 pKa = 3.7HH52 pKa = 6.04LKK54 pKa = 10.93ASEE57 pKa = 4.21FCGTVPGSFPVNTEE71 pKa = 3.4RR72 pKa = 11.84RR73 pKa = 11.84AKK75 pKa = 10.48AALSYY80 pKa = 10.95ARR82 pKa = 11.84NDD84 pKa = 3.41VNPEE88 pKa = 3.76RR89 pKa = 11.84VRR91 pKa = 11.84EE92 pKa = 4.01CARR95 pKa = 11.84RR96 pKa = 11.84KK97 pKa = 8.83AKK99 pKa = 10.52RR100 pKa = 11.84MGWFF104 pKa = 3.21
Molecular weight: 11.82 kDa
Isoelectric point according different methods:
Peptides (in silico digests for buttom-up proteomics)
Below you can find in silico digests of the whole proteome with Trypsin, Chymotrypsin, Trypsin+LysC, LysN, ArgC proteases suitable for different mass spec machines.| Try ESI |
 |
|---|
| ChTry ESI |
 |
|---|
| ArgC ESI |
 |
|---|
| LysN ESI |
 |
|---|
| TryLysC ESI |
 |
|---|
| Try MALDI |
 |
|---|
| ChTry MALDI |
 |
|---|
| ArgC MALDI |
 |
|---|
| LysN MALDI |
 |
|---|
| TryLysC MALDI |
 |
|---|
| Try LTQ |
 |
|---|
| ChTry LTQ |
 |
|---|
| ArgC LTQ |
 |
|---|
| LysN LTQ |
 |
|---|
| TryLysC LTQ |
 |
|---|
| Try MSlow |
 |
|---|
| ChTry MSlow |
 |
|---|
| ArgC MSlow |
 |
|---|
| LysN MSlow |
 |
|---|
| TryLysC MSlow |
 |
|---|
| Try MShigh |
 |
|---|
| ChTry MShigh |
 |
|---|
| ArgC MShigh |
 |
|---|
| LysN MShigh |
 |
|---|
| TryLysC MShigh |
 |
|---|
General Statistics
Number of major isoforms |
Number of additional isoforms |
Number of all proteins |
Number of amino acids |
Min. Seq. Length |
Max. Seq. Length |
Avg. Seq. Length |
Avg. Mol. Weight |
|---|---|---|---|---|---|---|---|
0 |
103435 |
50 |
1525 |
252.3 |
28.79 |
Amino acid frequency
Ala |
Cys |
Asp |
Glu |
Phe |
Gly |
His |
Ile |
Lys |
Leu |
|---|---|---|---|---|---|---|---|---|---|
5.266 ± 0.114 | 2.457 ± 0.109 |
4.926 ± 0.071 | 8.213 ± 0.164 |
5.539 ± 0.09 | 6.2 ± 0.134 |
1.78 ± 0.057 | 5.084 ± 0.079 |
8.709 ± 0.2 | 8.729 ± 0.134 |
Met |
Asn |
Gln |
Pro |
Arg |
Ser |
Thr |
Val |
Trp |
Tyr |
|---|---|---|---|---|---|---|---|---|---|
2.037 ± 0.05 | 4.132 ± 0.095 |
3.932 ± 0.106 | 3.482 ± 0.09 |
5.4 ± 0.099 | 7.51 ± 0.151 |
5.359 ± 0.125 | 6.525 ± 0.078 |
1.505 ± 0.048 | 3.216 ± 0.065 |
Most of the basic statistics you can see at this page can be downloaded from this CSV file
Proteome-pI is available under Creative Commons Attribution-NoDerivs license, for more details see here
| Reference: Kozlowski LP. Proteome-pI 2.0: Proteome Isoelectric Point Database Update. Nucleic Acids Res. 2021, doi: 10.1093/nar/gkab944 | Contact: Lukasz P. Kozlowski |
