Olsenella sp. oral taxon 809 str. F0356
Taxonomy: cellular organisms; Bacteria; Terrabacteria group; Actinobacteria; Coriobacteriia; Coriobacteriales; Atopobiaceae; Olsenella; unclassified Olsenella; Olsenella sp. oral taxon 809
Average proteome isoelectric point is 5.84
Get precalculated fractions of proteins

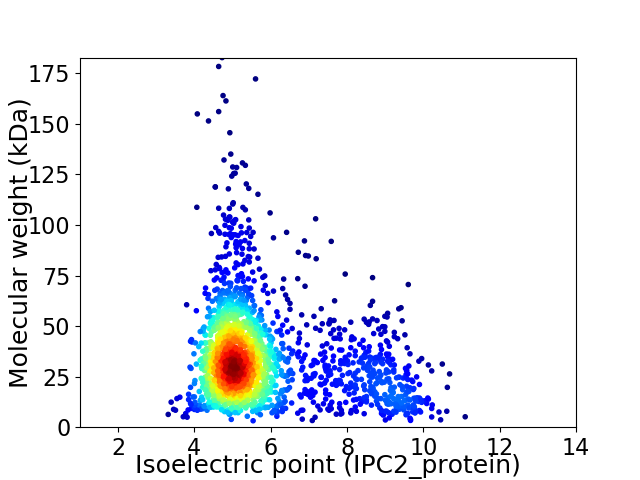
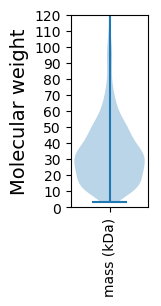
Virtual 2D-PAGE plot for 1898 proteins (isoelectric point calculated using IPC2_protein)
Get csv file with sequences according to given criteria:
* You can choose from 21 different methods for calculating isoelectric point
Summary statistics related to proteome-wise predictions


Protein with the lowest isoelectric point:
>tr|G5F643|G5F643_9ACTN PTS EIIA type-2 domain-containing protein OS=Olsenella sp. oral taxon 809 str. F0356 OX=661087 GN=HMPREF1008_01837 PE=4 SV=1
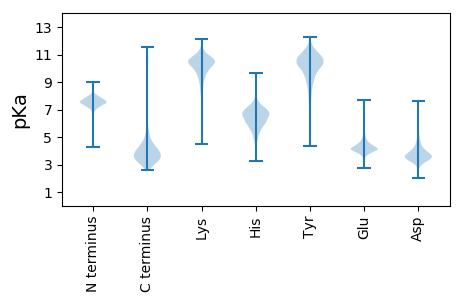
MM1 pKa = 7.54SISISRR7 pKa = 11.84RR8 pKa = 11.84SFLASCGLGLAAEE21 pKa = 4.52LAGCSAQGGGSAGGTAGSATEE42 pKa = 3.8AGYY45 pKa = 8.47TLVEE49 pKa = 4.31PGKK52 pKa = 9.37LTMISNFYY60 pKa = 10.41FPPFVSMNADD70 pKa = 3.12TGDD73 pKa = 3.62YY74 pKa = 11.08EE75 pKa = 5.16GFDD78 pKa = 3.3VDD80 pKa = 5.35LYY82 pKa = 11.42KK83 pKa = 10.71AVCEE87 pKa = 4.07KK88 pKa = 11.0LGLEE92 pKa = 4.16PNILPTVQFDD102 pKa = 4.33TIVPTIKK109 pKa = 10.24QGGKK113 pKa = 10.2ADD115 pKa = 3.6VSLGAVTITDD125 pKa = 3.44EE126 pKa = 4.19RR127 pKa = 11.84LQEE130 pKa = 3.8IDD132 pKa = 3.89FSNPYY137 pKa = 9.96LDD139 pKa = 3.92SNQAIVVKK147 pKa = 10.29QGSAATTADD156 pKa = 3.54ALNASGTQIAVQSGTTGEE174 pKa = 3.75AWSRR178 pKa = 11.84EE179 pKa = 4.0NLPNATIVPLDD190 pKa = 5.35DD191 pKa = 6.09IIQCLTGVQTGLYY204 pKa = 8.85AASVCDD210 pKa = 4.47LPVASYY216 pKa = 9.8EE217 pKa = 4.01ISSAYY222 pKa = 9.95ADD224 pKa = 4.03LVIPDD229 pKa = 4.67GGQIPTGEE237 pKa = 3.97QYY239 pKa = 11.29GIVVSKK245 pKa = 10.71DD246 pKa = 3.27NPKK249 pKa = 8.87LTQAINDD256 pKa = 4.15ALVEE260 pKa = 4.11LQSDD264 pKa = 4.53GTQDD268 pKa = 3.7QIEE271 pKa = 4.39QKK273 pKa = 10.05WFGSTII279 pKa = 3.33
MM1 pKa = 7.54SISISRR7 pKa = 11.84RR8 pKa = 11.84SFLASCGLGLAAEE21 pKa = 4.52LAGCSAQGGGSAGGTAGSATEE42 pKa = 3.8AGYY45 pKa = 8.47TLVEE49 pKa = 4.31PGKK52 pKa = 9.37LTMISNFYY60 pKa = 10.41FPPFVSMNADD70 pKa = 3.12TGDD73 pKa = 3.62YY74 pKa = 11.08EE75 pKa = 5.16GFDD78 pKa = 3.3VDD80 pKa = 5.35LYY82 pKa = 11.42KK83 pKa = 10.71AVCEE87 pKa = 4.07KK88 pKa = 11.0LGLEE92 pKa = 4.16PNILPTVQFDD102 pKa = 4.33TIVPTIKK109 pKa = 10.24QGGKK113 pKa = 10.2ADD115 pKa = 3.6VSLGAVTITDD125 pKa = 3.44EE126 pKa = 4.19RR127 pKa = 11.84LQEE130 pKa = 3.8IDD132 pKa = 3.89FSNPYY137 pKa = 9.96LDD139 pKa = 3.92SNQAIVVKK147 pKa = 10.29QGSAATTADD156 pKa = 3.54ALNASGTQIAVQSGTTGEE174 pKa = 3.75AWSRR178 pKa = 11.84EE179 pKa = 4.0NLPNATIVPLDD190 pKa = 5.35DD191 pKa = 6.09IIQCLTGVQTGLYY204 pKa = 8.85AASVCDD210 pKa = 4.47LPVASYY216 pKa = 9.8EE217 pKa = 4.01ISSAYY222 pKa = 9.95ADD224 pKa = 4.03LVIPDD229 pKa = 4.67GGQIPTGEE237 pKa = 3.97QYY239 pKa = 11.29GIVVSKK245 pKa = 10.71DD246 pKa = 3.27NPKK249 pKa = 8.87LTQAINDD256 pKa = 4.15ALVEE260 pKa = 4.11LQSDD264 pKa = 4.53GTQDD268 pKa = 3.7QIEE271 pKa = 4.39QKK273 pKa = 10.05WFGSTII279 pKa = 3.33
Molecular weight: 29.08 kDa
Isoelectric point according different methods:
Protein with the highest isoelectric point:
>tr|G5F2C6|G5F2C6_9ACTN Non-specific serine/threonine protein kinase OS=Olsenella sp. oral taxon 809 str. F0356 OX=661087 GN=HMPREF1008_00520 PE=4 SV=1
MM1 pKa = 7.35KK2 pKa = 9.42RR3 pKa = 11.84TYY5 pKa = 10.34QPNKK9 pKa = 8.62RR10 pKa = 11.84KK11 pKa = 9.56RR12 pKa = 11.84AKK14 pKa = 8.76THH16 pKa = 5.23GFRR19 pKa = 11.84ARR21 pKa = 11.84MATKK25 pKa = 10.11GGRR28 pKa = 11.84AVLSRR33 pKa = 11.84RR34 pKa = 11.84RR35 pKa = 11.84AKK37 pKa = 10.16GRR39 pKa = 11.84KK40 pKa = 8.12QLTVV44 pKa = 2.97
MM1 pKa = 7.35KK2 pKa = 9.42RR3 pKa = 11.84TYY5 pKa = 10.34QPNKK9 pKa = 8.62RR10 pKa = 11.84KK11 pKa = 9.56RR12 pKa = 11.84AKK14 pKa = 8.76THH16 pKa = 5.23GFRR19 pKa = 11.84ARR21 pKa = 11.84MATKK25 pKa = 10.11GGRR28 pKa = 11.84AVLSRR33 pKa = 11.84RR34 pKa = 11.84RR35 pKa = 11.84AKK37 pKa = 10.16GRR39 pKa = 11.84KK40 pKa = 8.12QLTVV44 pKa = 2.97
Molecular weight: 5.15 kDa
Isoelectric point according different methods:
Peptides (in silico digests for buttom-up proteomics)
Below you can find in silico digests of the whole proteome with Trypsin, Chymotrypsin, Trypsin+LysC, LysN, ArgC proteases suitable for different mass spec machines.| Try ESI |
 |
|---|
| ChTry ESI |
 |
|---|
| ArgC ESI |
 |
|---|
| LysN ESI |
 |
|---|
| TryLysC ESI |
 |
|---|
| Try MALDI |
 |
|---|
| ChTry MALDI |
 |
|---|
| ArgC MALDI |
 |
|---|
| LysN MALDI |
 |
|---|
| TryLysC MALDI |
 |
|---|
| Try LTQ |
 |
|---|
| ChTry LTQ |
 |
|---|
| ArgC LTQ |
 |
|---|
| LysN LTQ |
 |
|---|
| TryLysC LTQ |
 |
|---|
| Try MSlow |
 |
|---|
| ChTry MSlow |
 |
|---|
| ArgC MSlow |
 |
|---|
| LysN MSlow |
 |
|---|
| TryLysC MSlow |
 |
|---|
| Try MShigh |
 |
|---|
| ChTry MShigh |
 |
|---|
| ArgC MShigh |
 |
|---|
| LysN MShigh |
 |
|---|
| TryLysC MShigh |
 |
|---|
General Statistics
Number of major isoforms |
Number of additional isoforms |
Number of all proteins |
Number of amino acids |
Min. Seq. Length |
Max. Seq. Length |
Avg. Seq. Length |
Avg. Mol. Weight |
|---|---|---|---|---|---|---|---|
0 |
624498 |
30 |
1736 |
329.0 |
35.7 |
Amino acid frequency
Ala |
Cys |
Asp |
Glu |
Phe |
Gly |
His |
Ile |
Lys |
Leu |
|---|---|---|---|---|---|---|---|---|---|
11.185 ± 0.067 | 1.48 ± 0.024 |
6.337 ± 0.048 | 6.641 ± 0.056 |
3.366 ± 0.033 | 9.014 ± 0.042 |
1.9 ± 0.025 | 4.108 ± 0.045 |
3.128 ± 0.045 | 10.001 ± 0.071 |
Met |
Asn |
Gln |
Pro |
Arg |
Ser |
Thr |
Val |
Trp |
Tyr |
|---|---|---|---|---|---|---|---|---|---|
2.509 ± 0.025 | 2.42 ± 0.033 |
4.389 ± 0.034 | 2.968 ± 0.031 |
7.095 ± 0.064 | 6.401 ± 0.051 |
4.835 ± 0.043 | 8.501 ± 0.049 |
1.096 ± 0.021 | 2.627 ± 0.035 |
Most of the basic statistics you can see at this page can be downloaded from this CSV file
Proteome-pI is available under Creative Commons Attribution-NoDerivs license, for more details see here
| Reference: Kozlowski LP. Proteome-pI 2.0: Proteome Isoelectric Point Database Update. Nucleic Acids Res. 2021, doi: 10.1093/nar/gkab944 | Contact: Lukasz P. Kozlowski |
