Devosia enhydra
Taxonomy: cellular organisms; Bacteria; Proteobacteria; Alphaproteobacteria; Hyphomicrobiales; Devosiaceae; Devosia
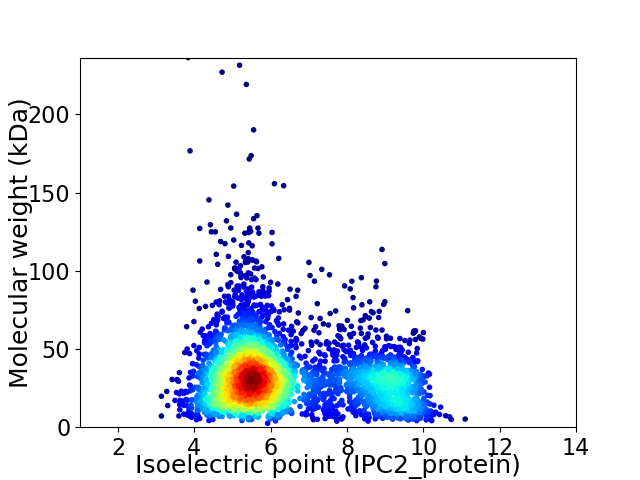
Average proteome isoelectric point is 6.42
Get precalculated fractions of proteins

Virtual 2D-PAGE plot for 3974 proteins (isoelectric point calculated using IPC2_protein)
Get csv file with sequences according to given criteria:
* You can choose from 21 different methods for calculating isoelectric point
Summary statistics related to proteome-wise predictions


Protein with the lowest isoelectric point:
>tr|A0A1K2I1R1|A0A1K2I1R1_9RHIZ Uncharacterized conserved protein DUF952 family OS=Devosia enhydra OX=665118 GN=SAMN02983003_3443 PE=4 SV=1
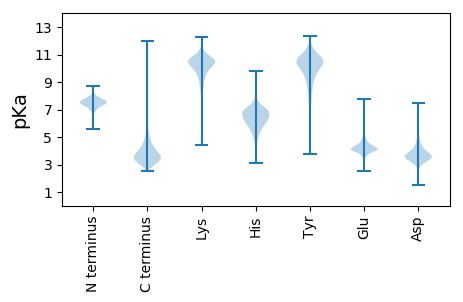
MM1 pKa = 7.79RR2 pKa = 11.84PHH4 pKa = 7.2ALLLGMNAALLLSTAVSAADD24 pKa = 4.73AITPAPVMPATVVFEE39 pKa = 4.27EE40 pKa = 4.36PALFSLTIEE49 pKa = 4.59GGVSAFGMPSTDD61 pKa = 3.42TIGTTNIGGLNGDD74 pKa = 3.54EE75 pKa = 4.26VLFEE79 pKa = 4.84GLDD82 pKa = 3.55DD83 pKa = 4.04MLFGGNLAAKK93 pKa = 9.87FSAPINDD100 pKa = 3.43SGAGVTVSGFGAFATRR116 pKa = 11.84SGSQSRR122 pKa = 11.84VLDD125 pKa = 3.81DD126 pKa = 3.68EE127 pKa = 4.53RR128 pKa = 11.84LLVIHH133 pKa = 7.06GPTLPVGTIGMYY145 pKa = 8.81TWDD148 pKa = 4.47LDD150 pKa = 4.44GIATGTGVGDD160 pKa = 3.96LGDD163 pKa = 4.28AEE165 pKa = 4.58STVTAGGGVAIPTANAATILGPVQDD190 pKa = 4.67VEE192 pKa = 4.39SSPDD196 pKa = 3.0GFTYY200 pKa = 10.62AGVIGDD206 pKa = 4.01YY207 pKa = 9.04QTFSLGALATTDD219 pKa = 2.93GAMFVGYY226 pKa = 10.7GEE228 pKa = 4.15LLGWEE233 pKa = 4.33VSTDD237 pKa = 3.0VTQNMVHH244 pKa = 6.46SGADD248 pKa = 3.3LTFSQTSSPDD258 pKa = 3.15GGNVAFTGYY267 pKa = 10.44AGPSFRR273 pKa = 11.84YY274 pKa = 9.93LSTEE278 pKa = 3.81TTTQTSVTPRR288 pKa = 11.84QFAEE292 pKa = 4.0YY293 pKa = 10.5APDD296 pKa = 3.42FEE298 pKa = 4.84YY299 pKa = 11.52AMFSLDD305 pKa = 3.75TIEE308 pKa = 5.63TIDD311 pKa = 3.25TYY313 pKa = 11.33YY314 pKa = 11.2AGGVVGGNIDD324 pKa = 3.21VSLWSGSTLSLGVGGGAYY342 pKa = 9.71YY343 pKa = 10.79ASSHH347 pKa = 5.52YY348 pKa = 10.88ASEE351 pKa = 4.53TEE353 pKa = 3.92ATLSGGSAAADD364 pKa = 2.97EE365 pKa = 5.28SVFSTLNLEE374 pKa = 4.45PEE376 pKa = 3.96TGFAYY381 pKa = 8.53TAKK384 pKa = 10.74ADD386 pKa = 4.01GKK388 pKa = 9.7FSAHH392 pKa = 5.83IGEE395 pKa = 4.2RR396 pKa = 11.84LQLNFGLGAEE406 pKa = 4.21YY407 pKa = 10.61LSRR410 pKa = 11.84VASARR415 pKa = 11.84FAGSNGMTVSDD426 pKa = 3.82TAGDD430 pKa = 3.91DD431 pKa = 3.62VGVPDD436 pKa = 5.77ADD438 pKa = 3.58FDD440 pKa = 4.56SSNATGSTILTFGDD454 pKa = 3.1AMSYY458 pKa = 10.35KK459 pKa = 9.88ATIGLTGQFF468 pKa = 3.77
MM1 pKa = 7.79RR2 pKa = 11.84PHH4 pKa = 7.2ALLLGMNAALLLSTAVSAADD24 pKa = 4.73AITPAPVMPATVVFEE39 pKa = 4.27EE40 pKa = 4.36PALFSLTIEE49 pKa = 4.59GGVSAFGMPSTDD61 pKa = 3.42TIGTTNIGGLNGDD74 pKa = 3.54EE75 pKa = 4.26VLFEE79 pKa = 4.84GLDD82 pKa = 3.55DD83 pKa = 4.04MLFGGNLAAKK93 pKa = 9.87FSAPINDD100 pKa = 3.43SGAGVTVSGFGAFATRR116 pKa = 11.84SGSQSRR122 pKa = 11.84VLDD125 pKa = 3.81DD126 pKa = 3.68EE127 pKa = 4.53RR128 pKa = 11.84LLVIHH133 pKa = 7.06GPTLPVGTIGMYY145 pKa = 8.81TWDD148 pKa = 4.47LDD150 pKa = 4.44GIATGTGVGDD160 pKa = 3.96LGDD163 pKa = 4.28AEE165 pKa = 4.58STVTAGGGVAIPTANAATILGPVQDD190 pKa = 4.67VEE192 pKa = 4.39SSPDD196 pKa = 3.0GFTYY200 pKa = 10.62AGVIGDD206 pKa = 4.01YY207 pKa = 9.04QTFSLGALATTDD219 pKa = 2.93GAMFVGYY226 pKa = 10.7GEE228 pKa = 4.15LLGWEE233 pKa = 4.33VSTDD237 pKa = 3.0VTQNMVHH244 pKa = 6.46SGADD248 pKa = 3.3LTFSQTSSPDD258 pKa = 3.15GGNVAFTGYY267 pKa = 10.44AGPSFRR273 pKa = 11.84YY274 pKa = 9.93LSTEE278 pKa = 3.81TTTQTSVTPRR288 pKa = 11.84QFAEE292 pKa = 4.0YY293 pKa = 10.5APDD296 pKa = 3.42FEE298 pKa = 4.84YY299 pKa = 11.52AMFSLDD305 pKa = 3.75TIEE308 pKa = 5.63TIDD311 pKa = 3.25TYY313 pKa = 11.33YY314 pKa = 11.2AGGVVGGNIDD324 pKa = 3.21VSLWSGSTLSLGVGGGAYY342 pKa = 9.71YY343 pKa = 10.79ASSHH347 pKa = 5.52YY348 pKa = 10.88ASEE351 pKa = 4.53TEE353 pKa = 3.92ATLSGGSAAADD364 pKa = 2.97EE365 pKa = 5.28SVFSTLNLEE374 pKa = 4.45PEE376 pKa = 3.96TGFAYY381 pKa = 8.53TAKK384 pKa = 10.74ADD386 pKa = 4.01GKK388 pKa = 9.7FSAHH392 pKa = 5.83IGEE395 pKa = 4.2RR396 pKa = 11.84LQLNFGLGAEE406 pKa = 4.21YY407 pKa = 10.61LSRR410 pKa = 11.84VASARR415 pKa = 11.84FAGSNGMTVSDD426 pKa = 3.82TAGDD430 pKa = 3.91DD431 pKa = 3.62VGVPDD436 pKa = 5.77ADD438 pKa = 3.58FDD440 pKa = 4.56SSNATGSTILTFGDD454 pKa = 3.1AMSYY458 pKa = 10.35KK459 pKa = 9.88ATIGLTGQFF468 pKa = 3.77
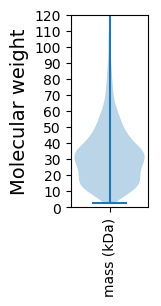
Molecular weight: 47.71 kDa
Isoelectric point according different methods:
Protein with the highest isoelectric point:
>tr|A0A1K2I211|A0A1K2I211_9RHIZ Uncharacterized protein OS=Devosia enhydra OX=665118 GN=SAMN02983003_3602 PE=4 SV=1
MM1 pKa = 7.35KK2 pKa = 9.43RR3 pKa = 11.84TYY5 pKa = 10.27QPSKK9 pKa = 9.74LVRR12 pKa = 11.84TRR14 pKa = 11.84RR15 pKa = 11.84HH16 pKa = 4.65GFRR19 pKa = 11.84ARR21 pKa = 11.84MATKK25 pKa = 10.37NGRR28 pKa = 11.84KK29 pKa = 9.04ILNLRR34 pKa = 11.84RR35 pKa = 11.84AVGRR39 pKa = 11.84KK40 pKa = 9.1KK41 pKa = 10.71LSAA44 pKa = 3.93
MM1 pKa = 7.35KK2 pKa = 9.43RR3 pKa = 11.84TYY5 pKa = 10.27QPSKK9 pKa = 9.74LVRR12 pKa = 11.84TRR14 pKa = 11.84RR15 pKa = 11.84HH16 pKa = 4.65GFRR19 pKa = 11.84ARR21 pKa = 11.84MATKK25 pKa = 10.37NGRR28 pKa = 11.84KK29 pKa = 9.04ILNLRR34 pKa = 11.84RR35 pKa = 11.84AVGRR39 pKa = 11.84KK40 pKa = 9.1KK41 pKa = 10.71LSAA44 pKa = 3.93
Molecular weight: 5.21 kDa
Isoelectric point according different methods:
Peptides (in silico digests for buttom-up proteomics)
Below you can find in silico digests of the whole proteome with Trypsin, Chymotrypsin, Trypsin+LysC, LysN, ArgC proteases suitable for different mass spec machines.| Try ESI |
 |
|---|
| ChTry ESI |
 |
|---|
| ArgC ESI |
 |
|---|
| LysN ESI |
 |
|---|
| TryLysC ESI |
 |
|---|
| Try MALDI |
 |
|---|
| ChTry MALDI |
 |
|---|
| ArgC MALDI |
 |
|---|
| LysN MALDI |
 |
|---|
| TryLysC MALDI |
 |
|---|
| Try LTQ |
 |
|---|
| ChTry LTQ |
 |
|---|
| ArgC LTQ |
 |
|---|
| LysN LTQ |
 |
|---|
| TryLysC LTQ |
 |
|---|
| Try MSlow |
 |
|---|
| ChTry MSlow |
 |
|---|
| ArgC MSlow |
 |
|---|
| LysN MSlow |
 |
|---|
| TryLysC MSlow |
 |
|---|
| Try MShigh |
 |
|---|
| ChTry MShigh |
 |
|---|
| ArgC MShigh |
 |
|---|
| LysN MShigh |
 |
|---|
| TryLysC MShigh |
 |
|---|
General Statistics
Number of major isoforms |
Number of additional isoforms |
Number of all proteins |
Number of amino acids |
Min. Seq. Length |
Max. Seq. Length |
Avg. Seq. Length |
Avg. Mol. Weight |
|---|---|---|---|---|---|---|---|
0 |
1260071 |
24 |
2366 |
317.1 |
34.2 |
Amino acid frequency
Ala |
Cys |
Asp |
Glu |
Phe |
Gly |
His |
Ile |
Lys |
Leu |
|---|---|---|---|---|---|---|---|---|---|
13.106 ± 0.052 | 0.701 ± 0.01 |
5.605 ± 0.029 | 5.587 ± 0.032 |
3.667 ± 0.026 | 8.875 ± 0.042 |
1.951 ± 0.019 | 5.314 ± 0.026 |
2.568 ± 0.031 | 10.489 ± 0.049 |
Met |
Asn |
Gln |
Pro |
Arg |
Ser |
Thr |
Val |
Trp |
Tyr |
|---|---|---|---|---|---|---|---|---|---|
2.504 ± 0.02 | 2.392 ± 0.025 |
5.469 ± 0.033 | 2.976 ± 0.021 |
7.267 ± 0.04 | 5.313 ± 0.028 |
5.31 ± 0.028 | 7.471 ± 0.033 |
1.3 ± 0.018 | 2.134 ± 0.016 |
Most of the basic statistics you can see at this page can be downloaded from this CSV file
Proteome-pI is available under Creative Commons Attribution-NoDerivs license, for more details see here
| Reference: Kozlowski LP. Proteome-pI 2.0: Proteome Isoelectric Point Database Update. Nucleic Acids Res. 2021, doi: 10.1093/nar/gkab944 | Contact: Lukasz P. Kozlowski |
