Conexivisphaera calida
Taxonomy: cellular organisms; Archaea; TACK group; Thaumarchaeota; Conexivisphaeri
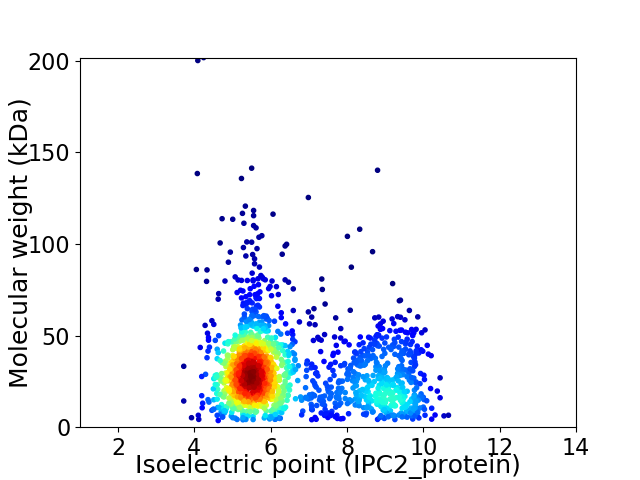
Average proteome isoelectric point is 6.53
Get precalculated fractions of proteins

Virtual 2D-PAGE plot for 1603 proteins (isoelectric point calculated using IPC2_protein)
Get csv file with sequences according to given criteria:
* You can choose from 21 different methods for calculating isoelectric point
Summary statistics related to proteome-wise predictions


Protein with the lowest isoelectric point:
>tr|A0A4P2VNS0|A0A4P2VNS0_9ARCH Molybdenum cofactor biosynthesis protein MoaC OS=Conexivisphaera calida OX=1874277 GN=NAS2_1166 PE=4 SV=1
MM1 pKa = 7.6LGALILIVIVLVGAFIVYY19 pKa = 9.95SYY21 pKa = 10.84VWSASGRR28 pKa = 11.84ITGAPGVMVSGASLTALPGGGGYY51 pKa = 7.21MTVDD55 pKa = 3.19ITNTGGVTGFASVAVYY71 pKa = 10.45SSSGQVFSAPGAPGLLYY88 pKa = 10.21QIYY91 pKa = 9.47YY92 pKa = 9.88IPTAWYY98 pKa = 9.78QPDD101 pKa = 3.47PTAVYY106 pKa = 10.32SAGLAAGSSFSSDD119 pKa = 2.29GFTWVASAGPWTTAQSGSSQNVNGQTQPNVIDD151 pKa = 4.02NLQAGYY157 pKa = 10.47SGGAPFPNPPVANGWDD173 pKa = 3.11AYY175 pKa = 10.33AIKK178 pKa = 10.39EE179 pKa = 3.74IGYY182 pKa = 9.48VVVTQPTTFYY192 pKa = 11.37VDD194 pKa = 2.8IDD196 pKa = 3.81GGLLSVEE203 pKa = 4.48PLSQGGASLTNWLGTGSNPGNLINQWRR230 pKa = 11.84GEE232 pKa = 3.98GATQYY237 pKa = 11.23SSNTVQPGTYY247 pKa = 9.64LIEE250 pKa = 4.25YY251 pKa = 9.74DD252 pKa = 3.51WFNGGGPAYY261 pKa = 10.39FSLWTNNPVQYY272 pKa = 10.54YY273 pKa = 10.19SPLQIAPGQVANEE286 pKa = 4.44SYY288 pKa = 10.33TVGSGIAPGDD298 pKa = 3.79TYY300 pKa = 11.08TVVVTLTTPRR310 pKa = 11.84GTATSSATVVASPP323 pKa = 4.18
MM1 pKa = 7.6LGALILIVIVLVGAFIVYY19 pKa = 9.95SYY21 pKa = 10.84VWSASGRR28 pKa = 11.84ITGAPGVMVSGASLTALPGGGGYY51 pKa = 7.21MTVDD55 pKa = 3.19ITNTGGVTGFASVAVYY71 pKa = 10.45SSSGQVFSAPGAPGLLYY88 pKa = 10.21QIYY91 pKa = 9.47YY92 pKa = 9.88IPTAWYY98 pKa = 9.78QPDD101 pKa = 3.47PTAVYY106 pKa = 10.32SAGLAAGSSFSSDD119 pKa = 2.29GFTWVASAGPWTTAQSGSSQNVNGQTQPNVIDD151 pKa = 4.02NLQAGYY157 pKa = 10.47SGGAPFPNPPVANGWDD173 pKa = 3.11AYY175 pKa = 10.33AIKK178 pKa = 10.39EE179 pKa = 3.74IGYY182 pKa = 9.48VVVTQPTTFYY192 pKa = 11.37VDD194 pKa = 2.8IDD196 pKa = 3.81GGLLSVEE203 pKa = 4.48PLSQGGASLTNWLGTGSNPGNLINQWRR230 pKa = 11.84GEE232 pKa = 3.98GATQYY237 pKa = 11.23SSNTVQPGTYY247 pKa = 9.64LIEE250 pKa = 4.25YY251 pKa = 9.74DD252 pKa = 3.51WFNGGGPAYY261 pKa = 10.39FSLWTNNPVQYY272 pKa = 10.54YY273 pKa = 10.19SPLQIAPGQVANEE286 pKa = 4.44SYY288 pKa = 10.33TVGSGIAPGDD298 pKa = 3.79TYY300 pKa = 11.08TVVVTLTTPRR310 pKa = 11.84GTATSSATVVASPP323 pKa = 4.18
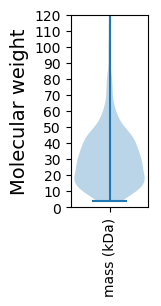
Molecular weight: 33.22 kDa
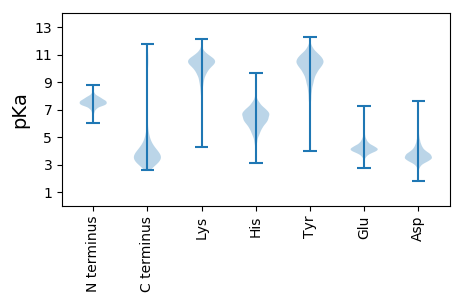
Isoelectric point according different methods:
Protein with the highest isoelectric point:
>tr|A0A4P2VBB3|A0A4P2VBB3_9ARCH FIG006285: ICC-like protein phosphoesterase OS=Conexivisphaera calida OX=1874277 GN=NAS2_0436 PE=4 SV=1
MM1 pKa = 7.48KK2 pKa = 10.57GKK4 pKa = 10.21GVQVWKK10 pKa = 10.13YY11 pKa = 8.62YY12 pKa = 10.11KK13 pKa = 10.53VEE15 pKa = 4.26GGTLTRR21 pKa = 11.84LRR23 pKa = 11.84RR24 pKa = 11.84EE25 pKa = 4.46CPRR28 pKa = 11.84CGPGVFMAQHH38 pKa = 7.28ADD40 pKa = 3.15RR41 pKa = 11.84LYY43 pKa = 10.8CGRR46 pKa = 11.84CGHH49 pKa = 5.79TMWLSSSSGSKK60 pKa = 10.42SSGQRR65 pKa = 11.84GTGRR69 pKa = 11.84GRR71 pKa = 11.84RR72 pKa = 11.84QQ73 pKa = 2.83
MM1 pKa = 7.48KK2 pKa = 10.57GKK4 pKa = 10.21GVQVWKK10 pKa = 10.13YY11 pKa = 8.62YY12 pKa = 10.11KK13 pKa = 10.53VEE15 pKa = 4.26GGTLTRR21 pKa = 11.84LRR23 pKa = 11.84RR24 pKa = 11.84EE25 pKa = 4.46CPRR28 pKa = 11.84CGPGVFMAQHH38 pKa = 7.28ADD40 pKa = 3.15RR41 pKa = 11.84LYY43 pKa = 10.8CGRR46 pKa = 11.84CGHH49 pKa = 5.79TMWLSSSSGSKK60 pKa = 10.42SSGQRR65 pKa = 11.84GTGRR69 pKa = 11.84GRR71 pKa = 11.84RR72 pKa = 11.84QQ73 pKa = 2.83
Molecular weight: 8.14 kDa
Isoelectric point according different methods:
Peptides (in silico digests for buttom-up proteomics)
Below you can find in silico digests of the whole proteome with Trypsin, Chymotrypsin, Trypsin+LysC, LysN, ArgC proteases suitable for different mass spec machines.| Try ESI |
 |
|---|
| ChTry ESI |
 |
|---|
| ArgC ESI |
 |
|---|
| LysN ESI |
 |
|---|
| TryLysC ESI |
 |
|---|
| Try MALDI |
 |
|---|
| ChTry MALDI |
 |
|---|
| ArgC MALDI |
 |
|---|
| LysN MALDI |
 |
|---|
| TryLysC MALDI |
 |
|---|
| Try LTQ |
 |
|---|
| ChTry LTQ |
 |
|---|
| ArgC LTQ |
 |
|---|
| LysN LTQ |
 |
|---|
| TryLysC LTQ |
 |
|---|
| Try MSlow |
 |
|---|
| ChTry MSlow |
 |
|---|
| ArgC MSlow |
 |
|---|
| LysN MSlow |
 |
|---|
| TryLysC MSlow |
 |
|---|
| Try MShigh |
 |
|---|
| ChTry MShigh |
 |
|---|
| ArgC MShigh |
 |
|---|
| LysN MShigh |
 |
|---|
| TryLysC MShigh |
 |
|---|
General Statistics
Number of major isoforms |
Number of additional isoforms |
Number of all proteins |
Number of amino acids |
Min. Seq. Length |
Max. Seq. Length |
Avg. Seq. Length |
Avg. Mol. Weight |
|---|---|---|---|---|---|---|---|
0 |
468978 |
37 |
1935 |
292.6 |
32.0 |
Amino acid frequency
Ala |
Cys |
Asp |
Glu |
Phe |
Gly |
His |
Ile |
Lys |
Leu |
|---|---|---|---|---|---|---|---|---|---|
10.185 ± 0.076 | 0.666 ± 0.023 |
5.052 ± 0.05 | 6.841 ± 0.077 |
3.107 ± 0.034 | 9.09 ± 0.052 |
1.609 ± 0.024 | 5.19 ± 0.038 |
3.081 ± 0.057 | 10.146 ± 0.072 |
Met |
Asn |
Gln |
Pro |
Arg |
Ser |
Thr |
Val |
Trp |
Tyr |
|---|---|---|---|---|---|---|---|---|---|
2.809 ± 0.028 | 2.241 ± 0.04 |
5.092 ± 0.046 | 1.815 ± 0.031 |
8.104 ± 0.094 | 7.128 ± 0.076 |
4.193 ± 0.067 | 8.91 ± 0.056 |
1.232 ± 0.029 | 3.509 ± 0.048 |
Most of the basic statistics you can see at this page can be downloaded from this CSV file
Proteome-pI is available under Creative Commons Attribution-NoDerivs license, for more details see here
| Reference: Kozlowski LP. Proteome-pI 2.0: Proteome Isoelectric Point Database Update. Nucleic Acids Res. 2021, doi: 10.1093/nar/gkab944 | Contact: Lukasz P. Kozlowski |
