Geobacter argillaceus
Taxonomy: cellular organisms; Bacteria; Proteobacteria; delta/epsilon subdivisions; Deltaproteobacteria; Desulfuromonadales; Geobacteraceae; Geobacter
Average proteome isoelectric point is 6.69
Get precalculated fractions of proteins
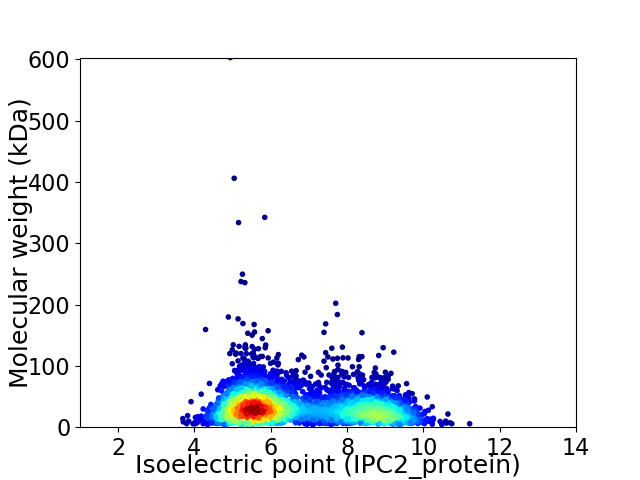
Virtual 2D-PAGE plot for 3944 proteins (isoelectric point calculated using IPC2_protein)
Get csv file with sequences according to given criteria:
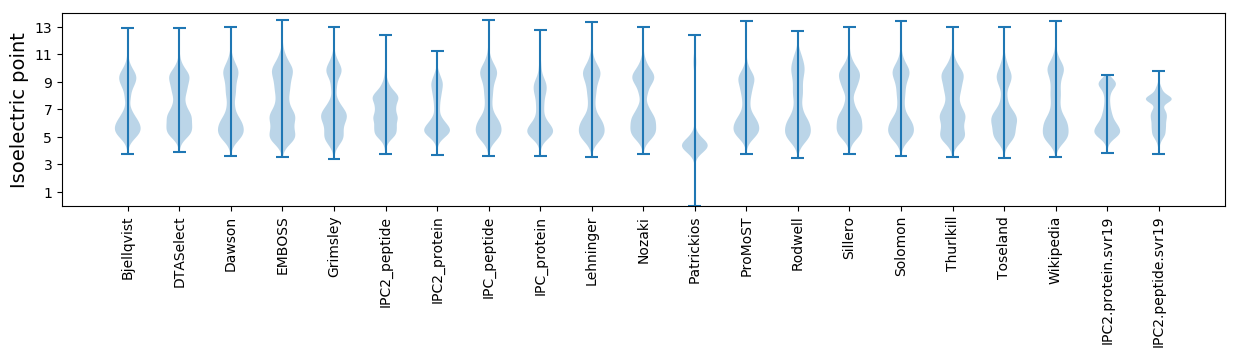
* You can choose from 21 different methods for calculating isoelectric point
Summary statistics related to proteome-wise predictions
Protein with the lowest isoelectric point:
>tr|A0A562VL82|A0A562VL82_9DELT Uncharacterized protein OS=Geobacter argillaceus OX=345631 GN=JN12_02466 PE=4 SV=1
MM1 pKa = 6.8QQWKK5 pKa = 8.45CTVCGYY11 pKa = 10.92VYY13 pKa = 10.87DD14 pKa = 4.3PVEE17 pKa = 4.77GDD19 pKa = 3.73ADD21 pKa = 3.72NGVPPGTPFEE31 pKa = 4.19EE32 pKa = 5.66LPDD35 pKa = 3.4GWACPICGAGKK46 pKa = 10.24DD47 pKa = 3.84LFEE50 pKa = 5.86KK51 pKa = 10.48II52 pKa = 4.12
MM1 pKa = 6.8QQWKK5 pKa = 8.45CTVCGYY11 pKa = 10.92VYY13 pKa = 10.87DD14 pKa = 4.3PVEE17 pKa = 4.77GDD19 pKa = 3.73ADD21 pKa = 3.72NGVPPGTPFEE31 pKa = 4.19EE32 pKa = 5.66LPDD35 pKa = 3.4GWACPICGAGKK46 pKa = 10.24DD47 pKa = 3.84LFEE50 pKa = 5.86KK51 pKa = 10.48II52 pKa = 4.12
Molecular weight: 5.65 kDa
Isoelectric point according different methods:
Protein with the highest isoelectric point:
>tr|A0A562VNT2|A0A562VNT2_9DELT DNA-3-methyladenine glycosylase I OS=Geobacter argillaceus OX=345631 GN=JN12_01820 PE=4 SV=1
MM1 pKa = 7.45KK2 pKa = 9.61RR3 pKa = 11.84TFQPSNTSRR12 pKa = 11.84KK13 pKa = 7.49RR14 pKa = 11.84THH16 pKa = 6.14GFLVRR21 pKa = 11.84MATKK25 pKa = 10.45NGRR28 pKa = 11.84LVIKK32 pKa = 10.39RR33 pKa = 11.84RR34 pKa = 11.84RR35 pKa = 11.84AKK37 pKa = 9.74GRR39 pKa = 11.84KK40 pKa = 8.4RR41 pKa = 11.84LAVGIATKK49 pKa = 10.64
MM1 pKa = 7.45KK2 pKa = 9.61RR3 pKa = 11.84TFQPSNTSRR12 pKa = 11.84KK13 pKa = 7.49RR14 pKa = 11.84THH16 pKa = 6.14GFLVRR21 pKa = 11.84MATKK25 pKa = 10.45NGRR28 pKa = 11.84LVIKK32 pKa = 10.39RR33 pKa = 11.84RR34 pKa = 11.84RR35 pKa = 11.84AKK37 pKa = 9.74GRR39 pKa = 11.84KK40 pKa = 8.4RR41 pKa = 11.84LAVGIATKK49 pKa = 10.64
Molecular weight: 5.68 kDa
Isoelectric point according different methods:
Peptides (in silico digests for buttom-up proteomics)
Below you can find in silico digests of the whole proteome with Trypsin, Chymotrypsin, Trypsin+LysC, LysN, ArgC proteases suitable for different mass spec machines.| Try ESI |
 |
|---|
| ChTry ESI |
|
|---|
| ArgC ESI |
|
|---|
| LysN ESI |
|
|---|
| TryLysC ESI |
|
|---|
| Try MALDI |
|
|---|
| ChTry MALDI |
|
|---|
| ArgC MALDI |
|
|---|
| LysN MALDI |
|
|---|
| TryLysC MALDI |
|
|---|
| Try LTQ |
|
|---|
| ChTry LTQ |
|
|---|
| ArgC LTQ |
|
|---|
| LysN LTQ |
|
|---|
| TryLysC LTQ |
|
|---|
| Try MSlow |
|
|---|
| ChTry MSlow |
|
|---|
| ArgC MSlow |
|
|---|
| LysN MSlow |
|
|---|
| TryLysC MSlow |
|
|---|
| Try MShigh |
|
|---|
| ChTry MShigh |
|
|---|
| ArgC MShigh |
|
|---|
| LysN MShigh |
|
|---|
| TryLysC MShigh |
|
|---|
General Statistics
Number of major isoforms |
Number of additional isoforms |
Number of all proteins |
Number of amino acids |
Min. Seq. Length |
Max. Seq. Length |
Avg. Seq. Length |
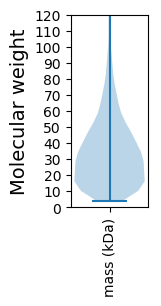
Avg. Mol. Weight |
|---|---|---|---|---|---|---|---|
0 |
1295148 |
39 |
5886 |
328.4 |
36.1 |
Amino acid frequency
Ala |
Cys |
Asp |
Glu |
Phe |
Gly |
His |
Ile |
Lys |
Leu |
|---|---|---|---|---|---|---|---|---|---|
9.752 ± 0.044 | 1.269 ± 0.024 |
5.12 ± 0.025 | 6.344 ± 0.053 |
3.96 ± 0.022 | 8.199 ± 0.041 |
2.017 ± 0.02 | 5.905 ± 0.031 |
4.669 ± 0.042 | 10.382 ± 0.053 |
Met |
Asn |
Gln |
Pro |
Arg |
Ser |
Thr |
Val |
Trp |
Tyr |
|---|---|---|---|---|---|---|---|---|---|
2.438 ± 0.02 | 3.256 ± 0.033 |
4.623 ± 0.031 | 3.208 ± 0.022 |
6.368 ± 0.045 | 5.583 ± 0.034 |
5.634 ± 0.051 | 7.475 ± 0.036 |
1.014 ± 0.015 | 2.786 ± 0.024 |
Most of the basic statistics you can see at this page can be downloaded from this CSV file
See this proteome in:

Proteome-pI is available under Creative Commons Attribution-NoDerivs license, for more details see here
| Reference: Kozlowski LP. Proteome-pI 2.0: Proteome Isoelectric Point Database Update. Nucleic Acids Res. 2021, doi: 10.1093/nar/gkab944 | Contact: Lukasz P. Kozlowski |