Williamwhitmania taraxaci
Taxonomy: cellular organisms; Bacteria; FCB group; Bacteroidetes/Chlorobi group; Bacteroidetes; Bacteroidia; Bacteroidales; Williamwhitmaniaceae; Williamwhitmania
Average proteome isoelectric point is 6.8
Get precalculated fractions of proteins

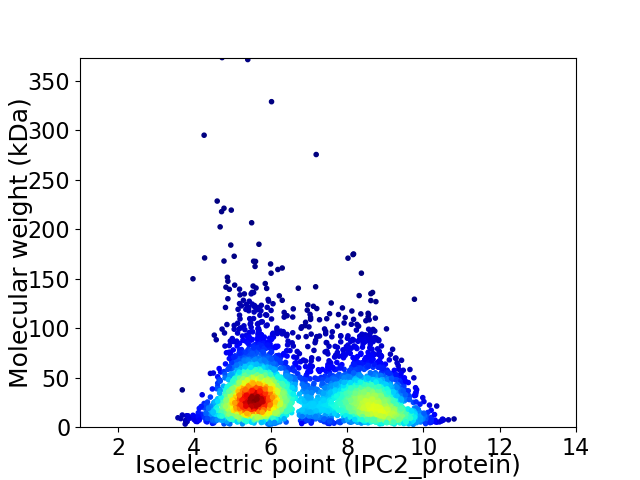
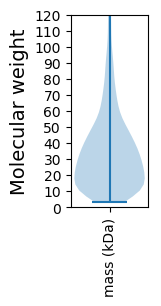
Virtual 2D-PAGE plot for 3616 proteins (isoelectric point calculated using IPC2_protein)
Get csv file with sequences according to given criteria:
* You can choose from 21 different methods for calculating isoelectric point
Summary statistics related to proteome-wise predictions


Protein with the lowest isoelectric point:
>tr|A0A1G6LB51|A0A1G6LB51_9BACT Chromosome partitioning protein ParB family OS=Williamwhitmania taraxaci OX=1640674 GN=SAMN05216323_103016 PE=3 SV=1
GG1 pKa = 6.63VTTTDD6 pKa = 3.98ILPSGYY12 pKa = 9.17TYY14 pKa = 11.26VSNDD18 pKa = 2.94LGASYY23 pKa = 11.37VPVTGIWTIGNLANGATASLNITATVLATGSYY55 pKa = 10.99ANTATVTSTTMDD67 pKa = 3.63PTPGNNTDD75 pKa = 3.36INTPVPNHH83 pKa = 6.23IPIAFDD89 pKa = 3.88DD90 pKa = 4.09SQTTFIEE97 pKa = 4.65TPVTIPVLGNDD108 pKa = 3.56TGLEE112 pKa = 4.13DD113 pKa = 4.11GGLAVTITVNPTNGTFVVNGDD134 pKa = 3.32NTVTYY139 pKa = 9.14TPNAGFTGTDD149 pKa = 2.98TFIYY153 pKa = 8.97QVCDD157 pKa = 3.43ADD159 pKa = 4.5GDD161 pKa = 4.48CATATVTITVNPTAINHH178 pKa = 6.07LPVAVNDD185 pKa = 4.08TTSTKK190 pKa = 10.28QDD192 pKa = 3.4TPVTIPVLGNDD203 pKa = 3.95SGLEE207 pKa = 3.99DD208 pKa = 4.29GGLMVTITVNPTNGTFVVNGDD229 pKa = 3.32NTVTYY234 pKa = 9.14TPNAGFTGIDD244 pKa = 2.68IFTYY248 pKa = 8.2QVCDD252 pKa = 3.72ANGDD256 pKa = 3.96CTTATVTITVIGTVIVPEE274 pKa = 4.43GFSPNGDD281 pKa = 2.91GVNDD285 pKa = 3.55NFVIPGLDD293 pKa = 3.36NFDD296 pKa = 4.01KK297 pKa = 11.19LSVEE301 pKa = 4.19IFNRR305 pKa = 11.84WGNVVYY311 pKa = 10.71KK312 pKa = 10.4EE313 pKa = 3.96EE314 pKa = 4.39HH315 pKa = 6.63YY316 pKa = 11.46KK317 pKa = 10.81NDD319 pKa = 3.29WDD321 pKa = 3.82GKK323 pKa = 8.72ANVGFTIGSDD333 pKa = 3.88LPVGTYY339 pKa = 9.71FFLVTIHH346 pKa = 7.49DD347 pKa = 4.01NGKK350 pKa = 10.2KK351 pKa = 7.69ITGYY355 pKa = 11.05VYY357 pKa = 9.38ITRR360 pKa = 4.25
GG1 pKa = 6.63VTTTDD6 pKa = 3.98ILPSGYY12 pKa = 9.17TYY14 pKa = 11.26VSNDD18 pKa = 2.94LGASYY23 pKa = 11.37VPVTGIWTIGNLANGATASLNITATVLATGSYY55 pKa = 10.99ANTATVTSTTMDD67 pKa = 3.63PTPGNNTDD75 pKa = 3.36INTPVPNHH83 pKa = 6.23IPIAFDD89 pKa = 3.88DD90 pKa = 4.09SQTTFIEE97 pKa = 4.65TPVTIPVLGNDD108 pKa = 3.56TGLEE112 pKa = 4.13DD113 pKa = 4.11GGLAVTITVNPTNGTFVVNGDD134 pKa = 3.32NTVTYY139 pKa = 9.14TPNAGFTGTDD149 pKa = 2.98TFIYY153 pKa = 8.97QVCDD157 pKa = 3.43ADD159 pKa = 4.5GDD161 pKa = 4.48CATATVTITVNPTAINHH178 pKa = 6.07LPVAVNDD185 pKa = 4.08TTSTKK190 pKa = 10.28QDD192 pKa = 3.4TPVTIPVLGNDD203 pKa = 3.95SGLEE207 pKa = 3.99DD208 pKa = 4.29GGLMVTITVNPTNGTFVVNGDD229 pKa = 3.32NTVTYY234 pKa = 9.14TPNAGFTGIDD244 pKa = 2.68IFTYY248 pKa = 8.2QVCDD252 pKa = 3.72ANGDD256 pKa = 3.96CTTATVTITVIGTVIVPEE274 pKa = 4.43GFSPNGDD281 pKa = 2.91GVNDD285 pKa = 3.55NFVIPGLDD293 pKa = 3.36NFDD296 pKa = 4.01KK297 pKa = 11.19LSVEE301 pKa = 4.19IFNRR305 pKa = 11.84WGNVVYY311 pKa = 10.71KK312 pKa = 10.4EE313 pKa = 3.96EE314 pKa = 4.39HH315 pKa = 6.63YY316 pKa = 11.46KK317 pKa = 10.81NDD319 pKa = 3.29WDD321 pKa = 3.82GKK323 pKa = 8.72ANVGFTIGSDD333 pKa = 3.88LPVGTYY339 pKa = 9.71FFLVTIHH346 pKa = 7.49DD347 pKa = 4.01NGKK350 pKa = 10.2KK351 pKa = 7.69ITGYY355 pKa = 11.05VYY357 pKa = 9.38ITRR360 pKa = 4.25
Molecular weight: 37.73 kDa
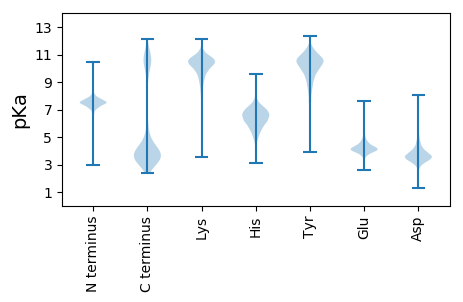
Isoelectric point according different methods:
Protein with the highest isoelectric point:
>tr|A0A1G6RK33|A0A1G6RK33_9BACT Uncharacterized protein OS=Williamwhitmania taraxaci OX=1640674 GN=SAMN05216323_107513 PE=4 SV=1
MM1 pKa = 7.51LGAICTLKK9 pKa = 10.81CEE11 pKa = 4.07NVILYY16 pKa = 9.92SRR18 pKa = 11.84NSSRR22 pKa = 11.84TLPRR26 pKa = 11.84FSTNGIFLLFATVRR40 pKa = 11.84RR41 pKa = 11.84VDD43 pKa = 3.53GFIANSKK50 pKa = 10.06NKK52 pKa = 10.14
MM1 pKa = 7.51LGAICTLKK9 pKa = 10.81CEE11 pKa = 4.07NVILYY16 pKa = 9.92SRR18 pKa = 11.84NSSRR22 pKa = 11.84TLPRR26 pKa = 11.84FSTNGIFLLFATVRR40 pKa = 11.84RR41 pKa = 11.84VDD43 pKa = 3.53GFIANSKK50 pKa = 10.06NKK52 pKa = 10.14
Molecular weight: 5.84 kDa
Isoelectric point according different methods:
Peptides (in silico digests for buttom-up proteomics)
Below you can find in silico digests of the whole proteome with Trypsin, Chymotrypsin, Trypsin+LysC, LysN, ArgC proteases suitable for different mass spec machines.| Try ESI |
 |
|---|
| ChTry ESI |
 |
|---|
| ArgC ESI |
 |
|---|
| LysN ESI |
 |
|---|
| TryLysC ESI |
 |
|---|
| Try MALDI |
 |
|---|
| ChTry MALDI |
 |
|---|
| ArgC MALDI |
 |
|---|
| LysN MALDI |
 |
|---|
| TryLysC MALDI |
 |
|---|
| Try LTQ |
 |
|---|
| ChTry LTQ |
 |
|---|
| ArgC LTQ |
 |
|---|
| LysN LTQ |
 |
|---|
| TryLysC LTQ |
 |
|---|
| Try MSlow |
 |
|---|
| ChTry MSlow |
 |
|---|
| ArgC MSlow |
 |
|---|
| LysN MSlow |
 |
|---|
| TryLysC MSlow |
 |
|---|
| Try MShigh |
 |
|---|
| ChTry MShigh |
 |
|---|
| ArgC MShigh |
 |
|---|
| LysN MShigh |
 |
|---|
| TryLysC MShigh |
 |
|---|
General Statistics
Number of major isoforms |
Number of additional isoforms |
Number of all proteins |
Number of amino acids |
Min. Seq. Length |
Max. Seq. Length |
Avg. Seq. Length |
Avg. Mol. Weight |
|---|---|---|---|---|---|---|---|
0 |
1202311 |
25 |
3589 |
332.5 |
37.21 |
Amino acid frequency
Ala |
Cys |
Asp |
Glu |
Phe |
Gly |
His |
Ile |
Lys |
Leu |
|---|---|---|---|---|---|---|---|---|---|
7.11 ± 0.044 | 0.911 ± 0.013 |
5.037 ± 0.03 | 6.073 ± 0.044 |
5.026 ± 0.035 | 6.785 ± 0.047 |
1.725 ± 0.018 | 7.673 ± 0.04 |
6.827 ± 0.045 | 9.552 ± 0.047 |
Met |
Asn |
Gln |
Pro |
Arg |
Ser |
Thr |
Val |
Trp |
Tyr |
|---|---|---|---|---|---|---|---|---|---|
2.45 ± 0.021 | 5.294 ± 0.041 |
3.648 ± 0.024 | 3.315 ± 0.021 |
4.124 ± 0.028 | 6.946 ± 0.033 |
5.825 ± 0.063 | 6.8 ± 0.036 |
1.026 ± 0.014 | 3.852 ± 0.028 |
Most of the basic statistics you can see at this page can be downloaded from this CSV file
Proteome-pI is available under Creative Commons Attribution-NoDerivs license, for more details see here
| Reference: Kozlowski LP. Proteome-pI 2.0: Proteome Isoelectric Point Database Update. Nucleic Acids Res. 2021, doi: 10.1093/nar/gkab944 | Contact: Lukasz P. Kozlowski |
