Methanosphaerula palustris (strain ATCC BAA-1556 / DSM 19958 / E1-9c)
Taxonomy: cellular organisms; Archaea; Euryarchaeota; Stenosarchaea group; Methanomicrobia; Methanomicrobiales; Methanoregulaceae; Methanosphaerula; Methanosphaerula palustris
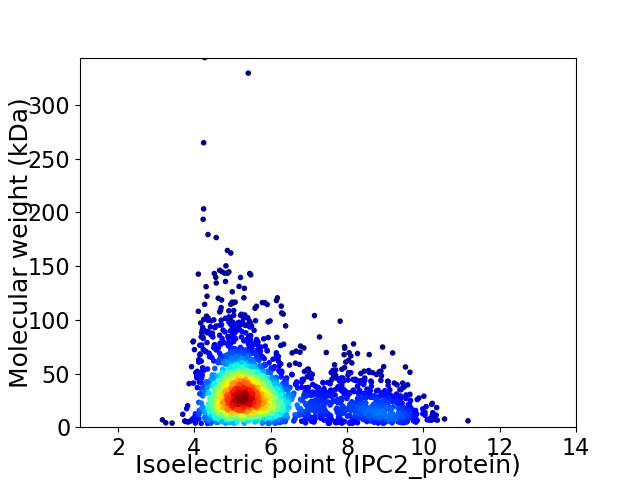
Average proteome isoelectric point is 5.94
Get precalculated fractions of proteins

Virtual 2D-PAGE plot for 2655 proteins (isoelectric point calculated using IPC2_protein)
Get csv file with sequences according to given criteria:
* You can choose from 21 different methods for calculating isoelectric point
Summary statistics related to proteome-wise predictions


Protein with the lowest isoelectric point:
>tr|B8GHQ2|B8GHQ2_METPE Metallophosphoesterase OS=Methanosphaerula palustris (strain ATCC BAA-1556 / DSM 19958 / E1-9c) OX=521011 GN=Mpal_1324 PE=4 SV=1
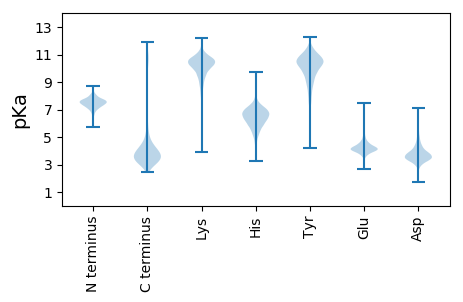
MM1 pKa = 8.52VLMNPNEE8 pKa = 4.31PDD10 pKa = 3.22TDD12 pKa = 3.42EE13 pKa = 4.85DD14 pKa = 3.77QPEE17 pKa = 4.12EE18 pKa = 4.25EE19 pKa = 4.82KK20 pKa = 10.67MVDD23 pKa = 3.54HH24 pKa = 6.36EE25 pKa = 4.85TLLEE29 pKa = 4.03MTADD33 pKa = 5.68DD34 pKa = 5.02IFADD38 pKa = 3.96CEE40 pKa = 4.41DD41 pKa = 4.51DD42 pKa = 4.05VVCIAEE48 pKa = 4.3ALEE51 pKa = 4.52DD52 pKa = 4.56LDD54 pKa = 3.78PAMRR58 pKa = 11.84DD59 pKa = 3.29EE60 pKa = 5.13LLVSDD65 pKa = 5.22HH66 pKa = 6.73LNAYY70 pKa = 6.92QTFYY74 pKa = 11.18YY75 pKa = 10.03YY76 pKa = 10.69FRR78 pKa = 11.84QIPEE82 pKa = 3.77EE83 pKa = 4.5LIQEE87 pKa = 4.19RR88 pKa = 11.84LILQPASALGEE99 pKa = 4.11GVLVEE104 pKa = 5.21EE105 pKa = 4.41IDD107 pKa = 3.91LYY109 pKa = 11.23EE110 pKa = 4.36LVFTVHH116 pKa = 6.3QRR118 pKa = 11.84GPLMAVSDD126 pKa = 4.42GEE128 pKa = 4.2ALLEE132 pKa = 4.31TFEE135 pKa = 5.05GPHH138 pKa = 6.61AYY140 pKa = 8.72TRR142 pKa = 11.84ARR144 pKa = 11.84AYY146 pKa = 10.54AEE148 pKa = 4.11DD149 pKa = 4.88LII151 pKa = 5.91
MM1 pKa = 8.52VLMNPNEE8 pKa = 4.31PDD10 pKa = 3.22TDD12 pKa = 3.42EE13 pKa = 4.85DD14 pKa = 3.77QPEE17 pKa = 4.12EE18 pKa = 4.25EE19 pKa = 4.82KK20 pKa = 10.67MVDD23 pKa = 3.54HH24 pKa = 6.36EE25 pKa = 4.85TLLEE29 pKa = 4.03MTADD33 pKa = 5.68DD34 pKa = 5.02IFADD38 pKa = 3.96CEE40 pKa = 4.41DD41 pKa = 4.51DD42 pKa = 4.05VVCIAEE48 pKa = 4.3ALEE51 pKa = 4.52DD52 pKa = 4.56LDD54 pKa = 3.78PAMRR58 pKa = 11.84DD59 pKa = 3.29EE60 pKa = 5.13LLVSDD65 pKa = 5.22HH66 pKa = 6.73LNAYY70 pKa = 6.92QTFYY74 pKa = 11.18YY75 pKa = 10.03YY76 pKa = 10.69FRR78 pKa = 11.84QIPEE82 pKa = 3.77EE83 pKa = 4.5LIQEE87 pKa = 4.19RR88 pKa = 11.84LILQPASALGEE99 pKa = 4.11GVLVEE104 pKa = 5.21EE105 pKa = 4.41IDD107 pKa = 3.91LYY109 pKa = 11.23EE110 pKa = 4.36LVFTVHH116 pKa = 6.3QRR118 pKa = 11.84GPLMAVSDD126 pKa = 4.42GEE128 pKa = 4.2ALLEE132 pKa = 4.31TFEE135 pKa = 5.05GPHH138 pKa = 6.61AYY140 pKa = 8.72TRR142 pKa = 11.84ARR144 pKa = 11.84AYY146 pKa = 10.54AEE148 pKa = 4.11DD149 pKa = 4.88LII151 pKa = 5.91
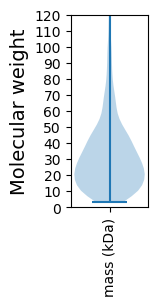
Molecular weight: 17.26 kDa
Isoelectric point according different methods:
Protein with the highest isoelectric point:
>sp|B8GEU6|IF6_METPE Translation initiation factor 6 OS=Methanosphaerula palustris (strain ATCC BAA-1556 / DSM 19958 / E1-9c) OX=521011 GN=eif6 PE=3 SV=1
MM1 pKa = 7.65SKK3 pKa = 8.86LTKK6 pKa = 9.74GRR8 pKa = 11.84KK9 pKa = 8.66IRR11 pKa = 11.84LSKK14 pKa = 10.13ATAQNRR20 pKa = 11.84RR21 pKa = 11.84VPSWVMIKK29 pKa = 8.99TKK31 pKa = 10.14RR32 pKa = 11.84AVVSHH37 pKa = 6.42PKK39 pKa = 8.99RR40 pKa = 11.84RR41 pKa = 11.84SWRR44 pKa = 11.84RR45 pKa = 11.84SSLKK49 pKa = 10.39VV50 pKa = 3.13
MM1 pKa = 7.65SKK3 pKa = 8.86LTKK6 pKa = 9.74GRR8 pKa = 11.84KK9 pKa = 8.66IRR11 pKa = 11.84LSKK14 pKa = 10.13ATAQNRR20 pKa = 11.84RR21 pKa = 11.84VPSWVMIKK29 pKa = 8.99TKK31 pKa = 10.14RR32 pKa = 11.84AVVSHH37 pKa = 6.42PKK39 pKa = 8.99RR40 pKa = 11.84RR41 pKa = 11.84SWRR44 pKa = 11.84RR45 pKa = 11.84SSLKK49 pKa = 10.39VV50 pKa = 3.13
Molecular weight: 5.9 kDa
Isoelectric point according different methods:
Peptides (in silico digests for buttom-up proteomics)
Below you can find in silico digests of the whole proteome with Trypsin, Chymotrypsin, Trypsin+LysC, LysN, ArgC proteases suitable for different mass spec machines.| Try ESI |
 |
|---|
| ChTry ESI |
 |
|---|
| ArgC ESI |
 |
|---|
| LysN ESI |
 |
|---|
| TryLysC ESI |
 |
|---|
| Try MALDI |
 |
|---|
| ChTry MALDI |
 |
|---|
| ArgC MALDI |
 |
|---|
| LysN MALDI |
 |
|---|
| TryLysC MALDI |
 |
|---|
| Try LTQ |
 |
|---|
| ChTry LTQ |
 |
|---|
| ArgC LTQ |
 |
|---|
| LysN LTQ |
 |
|---|
| TryLysC LTQ |
 |
|---|
| Try MSlow |
 |
|---|
| ChTry MSlow |
 |
|---|
| ArgC MSlow |
 |
|---|
| LysN MSlow |
 |
|---|
| TryLysC MSlow |
 |
|---|
| Try MShigh |
 |
|---|
| ChTry MShigh |
 |
|---|
| ArgC MShigh |
 |
|---|
| LysN MShigh |
 |
|---|
| TryLysC MShigh |
 |
|---|
General Statistics
Number of major isoforms |
Number of additional isoforms |
Number of all proteins |
Number of amino acids |
Min. Seq. Length |
Max. Seq. Length |
Avg. Seq. Length |
Avg. Mol. Weight |
|---|---|---|---|---|---|---|---|
0 |
818093 |
30 |
3295 |
308.1 |
33.81 |
Amino acid frequency
Ala |
Cys |
Asp |
Glu |
Phe |
Gly |
His |
Ile |
Lys |
Leu |
|---|---|---|---|---|---|---|---|---|---|
8.528 ± 0.064 | 1.258 ± 0.021 |
5.57 ± 0.035 | 6.077 ± 0.075 |
3.731 ± 0.034 | 8.15 ± 0.048 |
2.023 ± 0.022 | 7.001 ± 0.064 |
3.852 ± 0.047 | 9.449 ± 0.061 |
Met |
Asn |
Gln |
Pro |
Arg |
Ser |
Thr |
Val |
Trp |
Tyr |
|---|---|---|---|---|---|---|---|---|---|
2.534 ± 0.028 | 3.45 ± 0.051 |
4.764 ± 0.039 | 3.394 ± 0.024 |
5.564 ± 0.058 | 6.077 ± 0.046 |
6.79 ± 0.093 | 7.757 ± 0.045 |
1.044 ± 0.02 | 2.987 ± 0.034 |
Most of the basic statistics you can see at this page can be downloaded from this CSV file
Proteome-pI is available under Creative Commons Attribution-NoDerivs license, for more details see here
| Reference: Kozlowski LP. Proteome-pI 2.0: Proteome Isoelectric Point Database Update. Nucleic Acids Res. 2021, doi: 10.1093/nar/gkab944 | Contact: Lukasz P. Kozlowski |
