Cellulomonas fimi (strain ATCC 484 / DSM 20113 / JCM 1341 / NBRC 15513 / NCIMB 8980 / NCTC 7547)
Taxonomy: cellular organisms; Bacteria; Terrabacteria group; Actinobacteria; Actinomycetia; Micrococcales; Cellulomonadaceae; Cellulomonas; Cellulomonas fimi
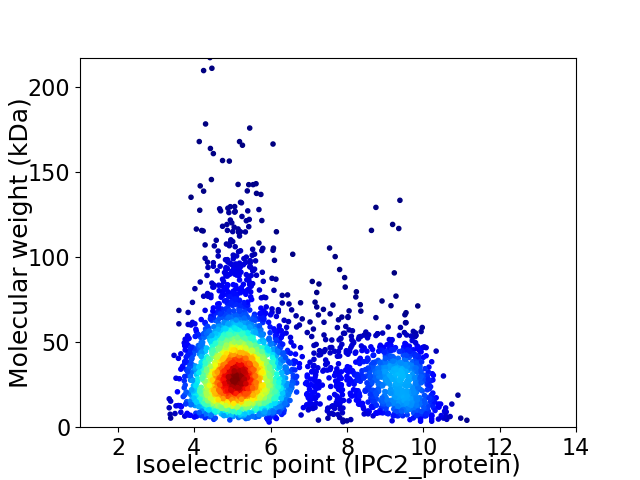
Average proteome isoelectric point is 6.1
Get precalculated fractions of proteins

Virtual 2D-PAGE plot for 3760 proteins (isoelectric point calculated using IPC2_protein)
Get csv file with sequences according to given criteria:
* You can choose from 21 different methods for calculating isoelectric point
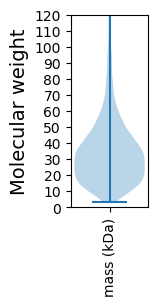
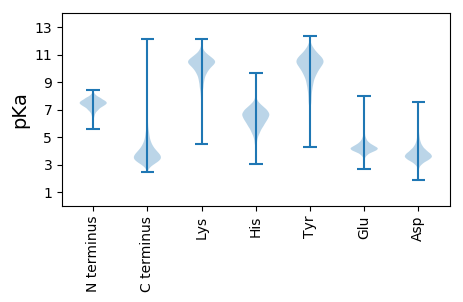
Summary statistics related to proteome-wise predictions


Protein with the lowest isoelectric point:
>tr|F4H157|F4H157_CELFA Uncharacterized protein OS=Cellulomonas fimi (strain ATCC 484 / DSM 20113 / JCM 1341 / NBRC 15513 / NCIMB 8980 / NCTC 7547) OX=590998 GN=Celf_3312 PE=4 SV=1
MM1 pKa = 7.19STTPDD6 pKa = 3.59GNDD9 pKa = 2.56WTAPGSPGKK18 pKa = 9.27PAATGGVGPAEE29 pKa = 4.48GSAPQTPGTDD39 pKa = 3.2VSADD43 pKa = 3.52SAPDD47 pKa = 3.26ARR49 pKa = 11.84ATGDD53 pKa = 3.84APVGAYY59 pKa = 7.81PSPAPYY65 pKa = 10.05AAPTGDD71 pKa = 3.78PAASGYY77 pKa = 10.34AAAAGHH83 pKa = 6.5GAPAGHH89 pKa = 7.09GAPAGYY95 pKa = 7.61GTPAGYY101 pKa = 9.34GAPAGYY107 pKa = 9.1GAPHH111 pKa = 7.02ATPTAYY117 pKa = 10.12GAAGPYY123 pKa = 10.42ARR125 pKa = 11.84TADD128 pKa = 3.78GGTSDD133 pKa = 4.33KK134 pKa = 11.39SFVAAWLLSLFLGTLGVDD152 pKa = 3.47RR153 pKa = 11.84FYY155 pKa = 11.11LGKK158 pKa = 10.59VGTGILKK165 pKa = 10.53LVTCGGLGVWAFVDD179 pKa = 4.1LLLVLTGSMRR189 pKa = 11.84DD190 pKa = 3.52TQGRR194 pKa = 11.84PLAGYY199 pKa = 10.02EE200 pKa = 4.11DD201 pKa = 4.03TKK203 pKa = 9.72KK204 pKa = 8.96TAWIVTGAAYY214 pKa = 9.45GASLLLGVVGGFAQLAAMAVVAANMPDD241 pKa = 3.58VVQEE245 pKa = 3.94DD246 pKa = 3.62SGYY249 pKa = 11.48GDD251 pKa = 6.29DD252 pKa = 5.43LDD254 pKa = 4.7DD255 pKa = 3.91WPAVEE260 pKa = 4.88EE261 pKa = 4.15PSPTEE266 pKa = 3.58EE267 pKa = 4.44APVVDD272 pKa = 4.69LTAAQWADD280 pKa = 3.33QEE282 pKa = 4.51FGTFEE287 pKa = 4.25VATHH291 pKa = 6.12SGVGDD296 pKa = 3.6AVVPLPAGAVGGLVTATHH314 pKa = 6.49DD315 pKa = 4.01GEE317 pKa = 4.59WNFVIDD323 pKa = 3.95VVDD326 pKa = 3.92AAGQPTGDD334 pKa = 3.68LVVNTIGAYY343 pKa = 10.06SGATAFGLSSVDD355 pKa = 3.39GGTSLQVVADD365 pKa = 4.31GAWTISVAPISSAPVLPPSGAGDD388 pKa = 3.89GVFLYY393 pKa = 10.61DD394 pKa = 4.01GEE396 pKa = 4.46EE397 pKa = 3.95ATFTGAHH404 pKa = 6.56DD405 pKa = 3.94GEE407 pKa = 5.13EE408 pKa = 4.12NFQVSQSRR416 pKa = 11.84AEE418 pKa = 4.12PPWWDD423 pKa = 3.62LPVNEE428 pKa = 4.82IGPWSGPLTLGSGPSVVEE446 pKa = 4.17VVADD450 pKa = 4.14GGWTLTTGG458 pKa = 3.31
MM1 pKa = 7.19STTPDD6 pKa = 3.59GNDD9 pKa = 2.56WTAPGSPGKK18 pKa = 9.27PAATGGVGPAEE29 pKa = 4.48GSAPQTPGTDD39 pKa = 3.2VSADD43 pKa = 3.52SAPDD47 pKa = 3.26ARR49 pKa = 11.84ATGDD53 pKa = 3.84APVGAYY59 pKa = 7.81PSPAPYY65 pKa = 10.05AAPTGDD71 pKa = 3.78PAASGYY77 pKa = 10.34AAAAGHH83 pKa = 6.5GAPAGHH89 pKa = 7.09GAPAGYY95 pKa = 7.61GTPAGYY101 pKa = 9.34GAPAGYY107 pKa = 9.1GAPHH111 pKa = 7.02ATPTAYY117 pKa = 10.12GAAGPYY123 pKa = 10.42ARR125 pKa = 11.84TADD128 pKa = 3.78GGTSDD133 pKa = 4.33KK134 pKa = 11.39SFVAAWLLSLFLGTLGVDD152 pKa = 3.47RR153 pKa = 11.84FYY155 pKa = 11.11LGKK158 pKa = 10.59VGTGILKK165 pKa = 10.53LVTCGGLGVWAFVDD179 pKa = 4.1LLLVLTGSMRR189 pKa = 11.84DD190 pKa = 3.52TQGRR194 pKa = 11.84PLAGYY199 pKa = 10.02EE200 pKa = 4.11DD201 pKa = 4.03TKK203 pKa = 9.72KK204 pKa = 8.96TAWIVTGAAYY214 pKa = 9.45GASLLLGVVGGFAQLAAMAVVAANMPDD241 pKa = 3.58VVQEE245 pKa = 3.94DD246 pKa = 3.62SGYY249 pKa = 11.48GDD251 pKa = 6.29DD252 pKa = 5.43LDD254 pKa = 4.7DD255 pKa = 3.91WPAVEE260 pKa = 4.88EE261 pKa = 4.15PSPTEE266 pKa = 3.58EE267 pKa = 4.44APVVDD272 pKa = 4.69LTAAQWADD280 pKa = 3.33QEE282 pKa = 4.51FGTFEE287 pKa = 4.25VATHH291 pKa = 6.12SGVGDD296 pKa = 3.6AVVPLPAGAVGGLVTATHH314 pKa = 6.49DD315 pKa = 4.01GEE317 pKa = 4.59WNFVIDD323 pKa = 3.95VVDD326 pKa = 3.92AAGQPTGDD334 pKa = 3.68LVVNTIGAYY343 pKa = 10.06SGATAFGLSSVDD355 pKa = 3.39GGTSLQVVADD365 pKa = 4.31GAWTISVAPISSAPVLPPSGAGDD388 pKa = 3.89GVFLYY393 pKa = 10.61DD394 pKa = 4.01GEE396 pKa = 4.46EE397 pKa = 3.95ATFTGAHH404 pKa = 6.56DD405 pKa = 3.94GEE407 pKa = 5.13EE408 pKa = 4.12NFQVSQSRR416 pKa = 11.84AEE418 pKa = 4.12PPWWDD423 pKa = 3.62LPVNEE428 pKa = 4.82IGPWSGPLTLGSGPSVVEE446 pKa = 4.17VVADD450 pKa = 4.14GGWTLTTGG458 pKa = 3.31
Molecular weight: 45.37 kDa
Isoelectric point according different methods:
Protein with the highest isoelectric point:
>tr|F4H0T5|F4H0T5_CELFA Regulatory protein TetR OS=Cellulomonas fimi (strain ATCC 484 / DSM 20113 / JCM 1341 / NBRC 15513 / NCIMB 8980 / NCTC 7547) OX=590998 GN=Celf_2054 PE=4 SV=1
MM1 pKa = 7.4GSVIKK6 pKa = 10.42KK7 pKa = 8.47RR8 pKa = 11.84RR9 pKa = 11.84KK10 pKa = 9.22RR11 pKa = 11.84MAKK14 pKa = 9.41KK15 pKa = 9.87KK16 pKa = 9.7HH17 pKa = 5.84RR18 pKa = 11.84KK19 pKa = 8.56LLRR22 pKa = 11.84KK23 pKa = 7.78TRR25 pKa = 11.84HH26 pKa = 3.65QRR28 pKa = 11.84RR29 pKa = 11.84NKK31 pKa = 9.78KK32 pKa = 9.85
MM1 pKa = 7.4GSVIKK6 pKa = 10.42KK7 pKa = 8.47RR8 pKa = 11.84RR9 pKa = 11.84KK10 pKa = 9.22RR11 pKa = 11.84MAKK14 pKa = 9.41KK15 pKa = 9.87KK16 pKa = 9.7HH17 pKa = 5.84RR18 pKa = 11.84KK19 pKa = 8.56LLRR22 pKa = 11.84KK23 pKa = 7.78TRR25 pKa = 11.84HH26 pKa = 3.65QRR28 pKa = 11.84RR29 pKa = 11.84NKK31 pKa = 9.78KK32 pKa = 9.85
Molecular weight: 4.08 kDa
Isoelectric point according different methods:
Peptides (in silico digests for buttom-up proteomics)
Below you can find in silico digests of the whole proteome with Trypsin, Chymotrypsin, Trypsin+LysC, LysN, ArgC proteases suitable for different mass spec machines.| Try ESI |
 |
|---|
| ChTry ESI |
 |
|---|
| ArgC ESI |
 |
|---|
| LysN ESI |
 |
|---|
| TryLysC ESI |
 |
|---|
| Try MALDI |
 |
|---|
| ChTry MALDI |
 |
|---|
| ArgC MALDI |
 |
|---|
| LysN MALDI |
 |
|---|
| TryLysC MALDI |
 |
|---|
| Try LTQ |
 |
|---|
| ChTry LTQ |
 |
|---|
| ArgC LTQ |
 |
|---|
| LysN LTQ |
 |
|---|
| TryLysC LTQ |
 |
|---|
| Try MSlow |
 |
|---|
| ChTry MSlow |
 |
|---|
| ArgC MSlow |
 |
|---|
| LysN MSlow |
 |
|---|
| TryLysC MSlow |
 |
|---|
| Try MShigh |
 |
|---|
| ChTry MShigh |
 |
|---|
| ArgC MShigh |
 |
|---|
| LysN MShigh |
 |
|---|
| TryLysC MShigh |
 |
|---|
General Statistics
Number of major isoforms |
Number of additional isoforms |
Number of all proteins |
Number of amino acids |
Min. Seq. Length |
Max. Seq. Length |
Avg. Seq. Length |
Avg. Mol. Weight |
|---|---|---|---|---|---|---|---|
0 |
1274721 |
30 |
2070 |
339.0 |
35.86 |
Amino acid frequency
Ala |
Cys |
Asp |
Glu |
Phe |
Gly |
His |
Ile |
Lys |
Leu |
|---|---|---|---|---|---|---|---|---|---|
14.812 ± 0.063 | 0.539 ± 0.01 |
6.717 ± 0.038 | 5.024 ± 0.039 |
2.44 ± 0.024 | 9.39 ± 0.037 |
2.149 ± 0.019 | 2.388 ± 0.032 |
1.266 ± 0.025 | 10.291 ± 0.047 |
Met |
Asn |
Gln |
Pro |
Arg |
Ser |
Thr |
Val |
Trp |
Tyr |
|---|---|---|---|---|---|---|---|---|---|
1.407 ± 0.015 | 1.376 ± 0.021 |
6.236 ± 0.04 | 2.634 ± 0.02 |
8.05 ± 0.044 | 4.676 ± 0.03 |
6.539 ± 0.041 | 10.712 ± 0.053 |
1.586 ± 0.021 | 1.772 ± 0.022 |
Most of the basic statistics you can see at this page can be downloaded from this CSV file
Proteome-pI is available under Creative Commons Attribution-NoDerivs license, for more details see here
| Reference: Kozlowski LP. Proteome-pI 2.0: Proteome Isoelectric Point Database Update. Nucleic Acids Res. 2021, doi: 10.1093/nar/gkab944 | Contact: Lukasz P. Kozlowski |
