candidate division MSBL1 archaeon SCGC-AAA259I09
Taxonomy: cellular organisms; Archaea; Euryarchaeota; Euryarchaeota incertae sedis; candidate division MSBL1
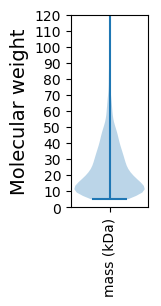
Average proteome isoelectric point is 6.21
Get precalculated fractions of proteins

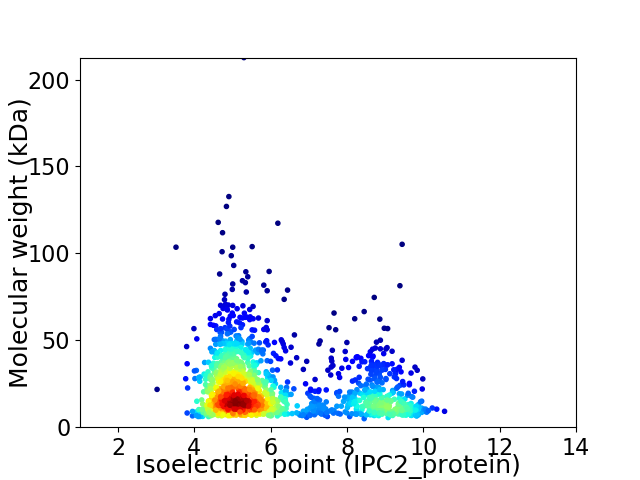
Virtual 2D-PAGE plot for 1400 proteins (isoelectric point calculated using IPC2_protein)
Get csv file with sequences according to given criteria:
* You can choose from 21 different methods for calculating isoelectric point
Summary statistics related to proteome-wise predictions


Protein with the lowest isoelectric point:
>tr|A0A133UL72|A0A133UL72_9EURY Aspartate carbamoyltransferase regulatory chain OS=candidate division MSBL1 archaeon SCGC-AAA259I09 OX=1698267 GN=pyrI PE=3 SV=1
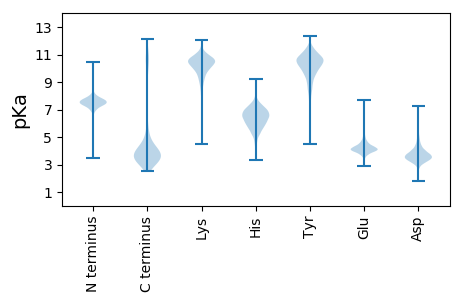
MM1 pKa = 7.94LEE3 pKa = 3.86FNIGFRR9 pKa = 11.84AIQQRR14 pKa = 11.84HH15 pKa = 5.64LEE17 pKa = 4.22CKK19 pKa = 10.26LYY21 pKa = 10.77GISAVGMDD29 pKa = 4.72LYY31 pKa = 11.25GIFPTEE37 pKa = 3.82GRR39 pKa = 11.84LEE41 pKa = 3.91PLYY44 pKa = 10.87FDD46 pKa = 6.19DD47 pKa = 5.72SDD49 pKa = 3.85TYY51 pKa = 11.72KK52 pKa = 11.07NGLAYY57 pKa = 10.31DD58 pKa = 4.77PIFDD62 pKa = 3.86RR63 pKa = 11.84LYY65 pKa = 8.55YY66 pKa = 10.61AQGQGSPDD74 pKa = 3.0LMYY77 pKa = 11.07YY78 pKa = 10.75DD79 pKa = 5.23FATDD83 pKa = 4.42SIVDD87 pKa = 3.85TNVDD91 pKa = 3.64LSGTTYY97 pKa = 11.31AATCKK102 pKa = 10.67GGDD105 pKa = 3.53YY106 pKa = 11.12YY107 pKa = 11.14FILDD111 pKa = 4.49GDD113 pKa = 4.76DD114 pKa = 3.84ALQMVPFDD122 pKa = 3.91MDD124 pKa = 3.42TGFGGVEE131 pKa = 3.78VLVSNITGDD140 pKa = 3.62DD141 pKa = 3.15RR142 pKa = 11.84TFAMGDD148 pKa = 2.99MDD150 pKa = 4.27FTQDD154 pKa = 3.2GKK156 pKa = 10.98ILVGASRR163 pKa = 11.84DD164 pKa = 3.41GDD166 pKa = 3.62GSVLFNYY173 pKa = 10.7DD174 pKa = 2.97MDD176 pKa = 6.03ADD178 pKa = 4.14TYY180 pKa = 10.68EE181 pKa = 4.1EE182 pKa = 4.58SIVTLGTEE190 pKa = 3.98IWWLQVSFCHH200 pKa = 6.95NGTLWAVRR208 pKa = 11.84HH209 pKa = 5.91DD210 pKa = 3.6TADD213 pKa = 3.03WYY215 pKa = 10.03TVTNPLDD222 pKa = 3.71PTNAALVSAGTLGVGGEE239 pKa = 4.33GFMDD243 pKa = 4.02VAAVHH248 pKa = 6.67PCTNRR253 pKa = 3.02
MM1 pKa = 7.94LEE3 pKa = 3.86FNIGFRR9 pKa = 11.84AIQQRR14 pKa = 11.84HH15 pKa = 5.64LEE17 pKa = 4.22CKK19 pKa = 10.26LYY21 pKa = 10.77GISAVGMDD29 pKa = 4.72LYY31 pKa = 11.25GIFPTEE37 pKa = 3.82GRR39 pKa = 11.84LEE41 pKa = 3.91PLYY44 pKa = 10.87FDD46 pKa = 6.19DD47 pKa = 5.72SDD49 pKa = 3.85TYY51 pKa = 11.72KK52 pKa = 11.07NGLAYY57 pKa = 10.31DD58 pKa = 4.77PIFDD62 pKa = 3.86RR63 pKa = 11.84LYY65 pKa = 8.55YY66 pKa = 10.61AQGQGSPDD74 pKa = 3.0LMYY77 pKa = 11.07YY78 pKa = 10.75DD79 pKa = 5.23FATDD83 pKa = 4.42SIVDD87 pKa = 3.85TNVDD91 pKa = 3.64LSGTTYY97 pKa = 11.31AATCKK102 pKa = 10.67GGDD105 pKa = 3.53YY106 pKa = 11.12YY107 pKa = 11.14FILDD111 pKa = 4.49GDD113 pKa = 4.76DD114 pKa = 3.84ALQMVPFDD122 pKa = 3.91MDD124 pKa = 3.42TGFGGVEE131 pKa = 3.78VLVSNITGDD140 pKa = 3.62DD141 pKa = 3.15RR142 pKa = 11.84TFAMGDD148 pKa = 2.99MDD150 pKa = 4.27FTQDD154 pKa = 3.2GKK156 pKa = 10.98ILVGASRR163 pKa = 11.84DD164 pKa = 3.41GDD166 pKa = 3.62GSVLFNYY173 pKa = 10.7DD174 pKa = 2.97MDD176 pKa = 6.03ADD178 pKa = 4.14TYY180 pKa = 10.68EE181 pKa = 4.1EE182 pKa = 4.58SIVTLGTEE190 pKa = 3.98IWWLQVSFCHH200 pKa = 6.95NGTLWAVRR208 pKa = 11.84HH209 pKa = 5.91DD210 pKa = 3.6TADD213 pKa = 3.03WYY215 pKa = 10.03TVTNPLDD222 pKa = 3.71PTNAALVSAGTLGVGGEE239 pKa = 4.33GFMDD243 pKa = 4.02VAAVHH248 pKa = 6.67PCTNRR253 pKa = 3.02
Molecular weight: 27.87 kDa
Isoelectric point according different methods:
Protein with the highest isoelectric point:
>tr|A0A133UJE7|A0A133UJE7_9EURY Uncharacterized protein (Fragment) OS=candidate division MSBL1 archaeon SCGC-AAA259I09 OX=1698267 GN=AKJ37_07705 PE=4 SV=1
MM1 pKa = 7.04QVRR4 pKa = 11.84VDD6 pKa = 4.94LQTCPCQVLLQFLPRR21 pKa = 11.84SPLYY25 pKa = 10.17RR26 pKa = 11.84QILRR30 pKa = 11.84FSRR33 pKa = 11.84LHH35 pKa = 5.38YY36 pKa = 10.23KK37 pKa = 10.31VIRR40 pKa = 11.84KK41 pKa = 9.36VGEE44 pKa = 3.56EE45 pKa = 4.15AEE47 pKa = 4.14WAKK50 pKa = 10.93VEE52 pKa = 4.03EE53 pKa = 4.36RR54 pKa = 11.84SNNSRR59 pKa = 11.84ILVTRR64 pKa = 11.84EE65 pKa = 3.04WGEE68 pKa = 3.75LKK70 pKa = 10.51KK71 pKa = 10.68ALKK74 pKa = 10.35NSSKK78 pKa = 9.93QVHH81 pKa = 5.64PVRR84 pKa = 11.84VGRR87 pKa = 4.12
MM1 pKa = 7.04QVRR4 pKa = 11.84VDD6 pKa = 4.94LQTCPCQVLLQFLPRR21 pKa = 11.84SPLYY25 pKa = 10.17RR26 pKa = 11.84QILRR30 pKa = 11.84FSRR33 pKa = 11.84LHH35 pKa = 5.38YY36 pKa = 10.23KK37 pKa = 10.31VIRR40 pKa = 11.84KK41 pKa = 9.36VGEE44 pKa = 3.56EE45 pKa = 4.15AEE47 pKa = 4.14WAKK50 pKa = 10.93VEE52 pKa = 4.03EE53 pKa = 4.36RR54 pKa = 11.84SNNSRR59 pKa = 11.84ILVTRR64 pKa = 11.84EE65 pKa = 3.04WGEE68 pKa = 3.75LKK70 pKa = 10.51KK71 pKa = 10.68ALKK74 pKa = 10.35NSSKK78 pKa = 9.93QVHH81 pKa = 5.64PVRR84 pKa = 11.84VGRR87 pKa = 4.12
Molecular weight: 10.33 kDa
Isoelectric point according different methods:
Peptides (in silico digests for buttom-up proteomics)
Below you can find in silico digests of the whole proteome with Trypsin, Chymotrypsin, Trypsin+LysC, LysN, ArgC proteases suitable for different mass spec machines.| Try ESI |
 |
|---|
| ChTry ESI |
 |
|---|
| ArgC ESI |
 |
|---|
| LysN ESI |
 |
|---|
| TryLysC ESI |
 |
|---|
| Try MALDI |
 |
|---|
| ChTry MALDI |
 |
|---|
| ArgC MALDI |
 |
|---|
| LysN MALDI |
 |
|---|
| TryLysC MALDI |
 |
|---|
| Try LTQ |
 |
|---|
| ChTry LTQ |
 |
|---|
| ArgC LTQ |
 |
|---|
| LysN LTQ |
 |
|---|
| TryLysC LTQ |
 |
|---|
| Try MSlow |
 |
|---|
| ChTry MSlow |
 |
|---|
| ArgC MSlow |
 |
|---|
| LysN MSlow |
 |
|---|
| TryLysC MSlow |
 |
|---|
| Try MShigh |
 |
|---|
| ChTry MShigh |
 |
|---|
| ArgC MShigh |
 |
|---|
| LysN MShigh |
 |
|---|
| TryLysC MShigh |
 |
|---|
General Statistics
Number of major isoforms |
Number of additional isoforms |
Number of all proteins |
Number of amino acids |
Min. Seq. Length |
Max. Seq. Length |
Avg. Seq. Length |
Avg. Mol. Weight |
|---|---|---|---|---|---|---|---|
0 |
305164 |
43 |
1838 |
218.0 |
24.58 |
Amino acid frequency
Ala |
Cys |
Asp |
Glu |
Phe |
Gly |
His |
Ile |
Lys |
Leu |
|---|---|---|---|---|---|---|---|---|---|
6.05 ± 0.075 | 1.043 ± 0.03 |
5.746 ± 0.06 | 10.393 ± 0.1 |
3.935 ± 0.058 | 7.541 ± 0.075 |
1.633 ± 0.026 | 6.927 ± 0.076 |
7.788 ± 0.092 | 8.897 ± 0.08 |
Met |
Asn |
Gln |
Pro |
Arg |
Ser |
Thr |
Val |
Trp |
Tyr |
|---|---|---|---|---|---|---|---|---|---|
2.215 ± 0.031 | 3.692 ± 0.046 |
4.206 ± 0.04 | 2.257 ± 0.035 |
5.852 ± 0.066 | 6.179 ± 0.047 |
4.693 ± 0.045 | 6.934 ± 0.062 |
1.109 ± 0.028 | 2.908 ± 0.042 |
Most of the basic statistics you can see at this page can be downloaded from this CSV file
Proteome-pI is available under Creative Commons Attribution-NoDerivs license, for more details see here
| Reference: Kozlowski LP. Proteome-pI 2.0: Proteome Isoelectric Point Database Update. Nucleic Acids Res. 2021, doi: 10.1093/nar/gkab944 | Contact: Lukasz P. Kozlowski |
