Sugarcane streak virus
Taxonomy: Viruses; Monodnaviria; Shotokuvirae; Cressdnaviricota; Repensiviricetes; Geplafuvirales; Geminiviridae; Mastrevirus
Average proteome isoelectric point is 7.87
Get precalculated fractions of proteins

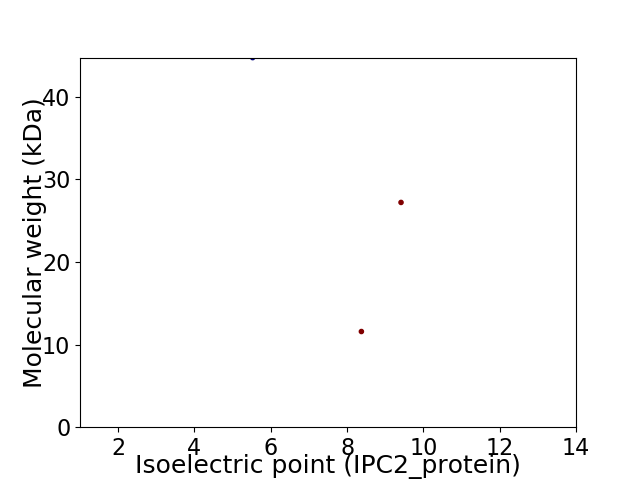
Virtual 2D-PAGE plot for 3 proteins (isoelectric point calculated using IPC2_protein)
Get csv file with sequences according to given criteria:
* You can choose from 21 different methods for calculating isoelectric point
Summary statistics related to proteome-wise predictions


Protein with the lowest isoelectric point:
>tr|B0Z3X5|B0Z3X5_9GEMI Replication-associated protein OS=Sugarcane streak virus OX=10836 PE=3 SV=1
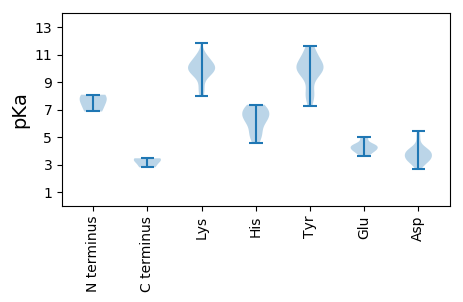
MM1 pKa = 6.86STVGSSMSSAPVRR14 pKa = 11.84RR15 pKa = 11.84FKK17 pKa = 10.85HH18 pKa = 6.17RR19 pKa = 11.84NVNTFLTYY27 pKa = 9.73PRR29 pKa = 11.84CNLDD33 pKa = 3.31PEE35 pKa = 4.45AVGLIIWNLISHH47 pKa = 7.24WNPAYY52 pKa = 9.62ILSVRR57 pKa = 11.84EE58 pKa = 3.76THH60 pKa = 6.81EE61 pKa = 4.49DD62 pKa = 3.07GGYY65 pKa = 9.93HH66 pKa = 5.24IHH68 pKa = 6.93VLAQSVKK75 pKa = 9.9PVYY78 pKa = 8.44TTDD81 pKa = 3.43PAFFDD86 pKa = 4.52IDD88 pKa = 3.48NHH90 pKa = 6.32HH91 pKa = 7.35PNIQSGKK98 pKa = 8.67SANKK102 pKa = 8.62IKK104 pKa = 10.62AYY106 pKa = 8.2ITKK109 pKa = 9.74KK110 pKa = 10.15PVSIWEE116 pKa = 4.14KK117 pKa = 9.53GTFIPRR123 pKa = 11.84KK124 pKa = 8.1TSFQGDD130 pKa = 3.68STEE133 pKa = 4.36PNSKK137 pKa = 9.98KK138 pKa = 9.84QSKK141 pKa = 10.53DD142 pKa = 3.27DD143 pKa = 3.36IVRR146 pKa = 11.84DD147 pKa = 4.03IIEE150 pKa = 4.43HH151 pKa = 5.04STNKK155 pKa = 9.66QEE157 pKa = 4.09YY158 pKa = 10.37LSMIQKK164 pKa = 10.03ALPYY168 pKa = 9.73EE169 pKa = 4.28WATKK173 pKa = 9.84LQYY176 pKa = 10.43FEE178 pKa = 4.96YY179 pKa = 10.26SANKK183 pKa = 9.73LFPDD187 pKa = 3.45TQEE190 pKa = 4.51IYY192 pKa = 10.11TSPFPRR198 pKa = 11.84TTPNLLDD205 pKa = 3.41TTTINTWLQNNLYY218 pKa = 9.7QVSPQAYY225 pKa = 8.22MLTNPSCLTLEE236 pKa = 4.35EE237 pKa = 4.43AASDD241 pKa = 4.04LTWMAEE247 pKa = 4.0TSRR250 pKa = 11.84ILIPTGSSASTSSGQQEE267 pKa = 4.05RR268 pKa = 11.84ASQHH272 pKa = 5.23GQEE275 pKa = 4.02AWEE278 pKa = 4.87DD279 pKa = 3.75IITGRR284 pKa = 11.84TTSTGSSYY292 pKa = 11.64DD293 pKa = 3.16EE294 pKa = 4.22DD295 pKa = 4.2AEE297 pKa = 4.35YY298 pKa = 11.16NIIDD302 pKa = 5.47DD303 pKa = 4.95IPFKK307 pKa = 11.07YY308 pKa = 9.94CPCWKK313 pKa = 10.13QLIGCQKK320 pKa = 10.89DD321 pKa = 3.8YY322 pKa = 11.15IVNPKK327 pKa = 8.71YY328 pKa = 10.79GKK330 pKa = 9.49RR331 pKa = 11.84KK332 pKa = 9.39KK333 pKa = 9.61VAHH336 pKa = 6.49KK337 pKa = 10.25SIPTIVLANEE347 pKa = 4.03DD348 pKa = 3.98EE349 pKa = 5.0DD350 pKa = 3.86WFKK353 pKa = 11.84DD354 pKa = 3.56MSPAQQDD361 pKa = 3.84YY362 pKa = 11.01FNANCTTYY370 pKa = 10.06MLEE373 pKa = 3.93PGEE376 pKa = 4.96RR377 pKa = 11.84FFSPPAVSATAHH389 pKa = 6.68PSDD392 pKa = 4.07EE393 pKa = 4.36VV394 pKa = 3.32
MM1 pKa = 6.86STVGSSMSSAPVRR14 pKa = 11.84RR15 pKa = 11.84FKK17 pKa = 10.85HH18 pKa = 6.17RR19 pKa = 11.84NVNTFLTYY27 pKa = 9.73PRR29 pKa = 11.84CNLDD33 pKa = 3.31PEE35 pKa = 4.45AVGLIIWNLISHH47 pKa = 7.24WNPAYY52 pKa = 9.62ILSVRR57 pKa = 11.84EE58 pKa = 3.76THH60 pKa = 6.81EE61 pKa = 4.49DD62 pKa = 3.07GGYY65 pKa = 9.93HH66 pKa = 5.24IHH68 pKa = 6.93VLAQSVKK75 pKa = 9.9PVYY78 pKa = 8.44TTDD81 pKa = 3.43PAFFDD86 pKa = 4.52IDD88 pKa = 3.48NHH90 pKa = 6.32HH91 pKa = 7.35PNIQSGKK98 pKa = 8.67SANKK102 pKa = 8.62IKK104 pKa = 10.62AYY106 pKa = 8.2ITKK109 pKa = 9.74KK110 pKa = 10.15PVSIWEE116 pKa = 4.14KK117 pKa = 9.53GTFIPRR123 pKa = 11.84KK124 pKa = 8.1TSFQGDD130 pKa = 3.68STEE133 pKa = 4.36PNSKK137 pKa = 9.98KK138 pKa = 9.84QSKK141 pKa = 10.53DD142 pKa = 3.27DD143 pKa = 3.36IVRR146 pKa = 11.84DD147 pKa = 4.03IIEE150 pKa = 4.43HH151 pKa = 5.04STNKK155 pKa = 9.66QEE157 pKa = 4.09YY158 pKa = 10.37LSMIQKK164 pKa = 10.03ALPYY168 pKa = 9.73EE169 pKa = 4.28WATKK173 pKa = 9.84LQYY176 pKa = 10.43FEE178 pKa = 4.96YY179 pKa = 10.26SANKK183 pKa = 9.73LFPDD187 pKa = 3.45TQEE190 pKa = 4.51IYY192 pKa = 10.11TSPFPRR198 pKa = 11.84TTPNLLDD205 pKa = 3.41TTTINTWLQNNLYY218 pKa = 9.7QVSPQAYY225 pKa = 8.22MLTNPSCLTLEE236 pKa = 4.35EE237 pKa = 4.43AASDD241 pKa = 4.04LTWMAEE247 pKa = 4.0TSRR250 pKa = 11.84ILIPTGSSASTSSGQQEE267 pKa = 4.05RR268 pKa = 11.84ASQHH272 pKa = 5.23GQEE275 pKa = 4.02AWEE278 pKa = 4.87DD279 pKa = 3.75IITGRR284 pKa = 11.84TTSTGSSYY292 pKa = 11.64DD293 pKa = 3.16EE294 pKa = 4.22DD295 pKa = 4.2AEE297 pKa = 4.35YY298 pKa = 11.16NIIDD302 pKa = 5.47DD303 pKa = 4.95IPFKK307 pKa = 11.07YY308 pKa = 9.94CPCWKK313 pKa = 10.13QLIGCQKK320 pKa = 10.89DD321 pKa = 3.8YY322 pKa = 11.15IVNPKK327 pKa = 8.71YY328 pKa = 10.79GKK330 pKa = 9.49RR331 pKa = 11.84KK332 pKa = 9.39KK333 pKa = 9.61VAHH336 pKa = 6.49KK337 pKa = 10.25SIPTIVLANEE347 pKa = 4.03DD348 pKa = 3.98EE349 pKa = 5.0DD350 pKa = 3.86WFKK353 pKa = 11.84DD354 pKa = 3.56MSPAQQDD361 pKa = 3.84YY362 pKa = 11.01FNANCTTYY370 pKa = 10.06MLEE373 pKa = 3.93PGEE376 pKa = 4.96RR377 pKa = 11.84FFSPPAVSATAHH389 pKa = 6.68PSDD392 pKa = 4.07EE393 pKa = 4.36VV394 pKa = 3.32
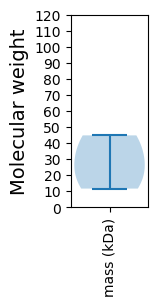
Molecular weight: 44.74 kDa
Isoelectric point according different methods:
Protein with the highest isoelectric point:
>tr|B0Z3X5|B0Z3X5_9GEMI Replication-associated protein OS=Sugarcane streak virus OX=10836 PE=3 SV=1
MM1 pKa = 7.68PLSGMKK7 pKa = 10.2RR8 pKa = 11.84KK9 pKa = 10.1RR10 pKa = 11.84SDD12 pKa = 2.69EE13 pKa = 3.64AARR16 pKa = 11.84RR17 pKa = 11.84KK18 pKa = 10.11RR19 pKa = 11.84MSGAKK24 pKa = 9.27QGRR27 pKa = 11.84TSAARR32 pKa = 11.84VAPSVRR38 pKa = 11.84KK39 pKa = 9.57IRR41 pKa = 11.84PSLQIQTLQAAGQTMISVPSGGVCEE66 pKa = 4.18LLGTFSRR73 pKa = 11.84GSDD76 pKa = 2.89EE77 pKa = 4.71GNRR80 pKa = 11.84HH81 pKa = 4.56TNEE84 pKa = 3.59TVIYY88 pKa = 9.51KK89 pKa = 10.32VSLDD93 pKa = 3.51YY94 pKa = 11.48HH95 pKa = 6.38FVATAASCKK104 pKa = 9.73YY105 pKa = 10.25SSIGTGVVWLVYY117 pKa = 10.04DD118 pKa = 4.33AQPSGNAPTVKK129 pKa = 10.33DD130 pKa = 3.86IFPHH134 pKa = 7.03PDD136 pKa = 2.84TLTAFPYY143 pKa = 7.28TWKK146 pKa = 10.49VGRR149 pKa = 11.84EE150 pKa = 3.83VCHH153 pKa = 6.21RR154 pKa = 11.84FVVKK158 pKa = 10.56RR159 pKa = 11.84RR160 pKa = 11.84YY161 pKa = 7.89TFTMEE166 pKa = 3.63VNGRR170 pKa = 11.84IGSDD174 pKa = 3.51VPGSTSCWPPCRR186 pKa = 11.84RR187 pKa = 11.84NIYY190 pKa = 7.82FHH192 pKa = 7.11KK193 pKa = 10.11FVTGLGVKK201 pKa = 7.98TEE203 pKa = 4.14WKK205 pKa = 8.16NTTGGDD211 pKa = 3.17VGDD214 pKa = 3.87IKK216 pKa = 10.91KK217 pKa = 10.04GALYY221 pKa = 10.22IVVAPGNGLEE231 pKa = 4.27FTVHH235 pKa = 5.73GNARR239 pKa = 11.84LYY241 pKa = 10.33FKK243 pKa = 10.94SVGNQQ248 pKa = 2.8
MM1 pKa = 7.68PLSGMKK7 pKa = 10.2RR8 pKa = 11.84KK9 pKa = 10.1RR10 pKa = 11.84SDD12 pKa = 2.69EE13 pKa = 3.64AARR16 pKa = 11.84RR17 pKa = 11.84KK18 pKa = 10.11RR19 pKa = 11.84MSGAKK24 pKa = 9.27QGRR27 pKa = 11.84TSAARR32 pKa = 11.84VAPSVRR38 pKa = 11.84KK39 pKa = 9.57IRR41 pKa = 11.84PSLQIQTLQAAGQTMISVPSGGVCEE66 pKa = 4.18LLGTFSRR73 pKa = 11.84GSDD76 pKa = 2.89EE77 pKa = 4.71GNRR80 pKa = 11.84HH81 pKa = 4.56TNEE84 pKa = 3.59TVIYY88 pKa = 9.51KK89 pKa = 10.32VSLDD93 pKa = 3.51YY94 pKa = 11.48HH95 pKa = 6.38FVATAASCKK104 pKa = 9.73YY105 pKa = 10.25SSIGTGVVWLVYY117 pKa = 10.04DD118 pKa = 4.33AQPSGNAPTVKK129 pKa = 10.33DD130 pKa = 3.86IFPHH134 pKa = 7.03PDD136 pKa = 2.84TLTAFPYY143 pKa = 7.28TWKK146 pKa = 10.49VGRR149 pKa = 11.84EE150 pKa = 3.83VCHH153 pKa = 6.21RR154 pKa = 11.84FVVKK158 pKa = 10.56RR159 pKa = 11.84RR160 pKa = 11.84YY161 pKa = 7.89TFTMEE166 pKa = 3.63VNGRR170 pKa = 11.84IGSDD174 pKa = 3.51VPGSTSCWPPCRR186 pKa = 11.84RR187 pKa = 11.84NIYY190 pKa = 7.82FHH192 pKa = 7.11KK193 pKa = 10.11FVTGLGVKK201 pKa = 7.98TEE203 pKa = 4.14WKK205 pKa = 8.16NTTGGDD211 pKa = 3.17VGDD214 pKa = 3.87IKK216 pKa = 10.91KK217 pKa = 10.04GALYY221 pKa = 10.22IVVAPGNGLEE231 pKa = 4.27FTVHH235 pKa = 5.73GNARR239 pKa = 11.84LYY241 pKa = 10.33FKK243 pKa = 10.94SVGNQQ248 pKa = 2.8
Molecular weight: 27.21 kDa
Isoelectric point according different methods:
Peptides (in silico digests for buttom-up proteomics)
Below you can find in silico digests of the whole proteome with Trypsin, Chymotrypsin, Trypsin+LysC, LysN, ArgC proteases suitable for different mass spec machines.| Try ESI |
 |
|---|
| ChTry ESI |
 |
|---|
| ArgC ESI |
 |
|---|
| LysN ESI |
 |
|---|
| TryLysC ESI |
 |
|---|
| Try MALDI |
 |
|---|
| ChTry MALDI |
 |
|---|
| ArgC MALDI |
 |
|---|
| LysN MALDI |
 |
|---|
| TryLysC MALDI |
 |
|---|
| Try LTQ |
 |
|---|
| ChTry LTQ |
 |
|---|
| ArgC LTQ |
 |
|---|
| LysN LTQ |
 |
|---|
| TryLysC LTQ |
 |
|---|
| Try MSlow |
 |
|---|
| ChTry MSlow |
 |
|---|
| ArgC MSlow |
 |
|---|
| LysN MSlow |
 |
|---|
| TryLysC MSlow |
 |
|---|
| Try MShigh |
 |
|---|
| ChTry MShigh |
 |
|---|
| ArgC MShigh |
 |
|---|
| LysN MShigh |
 |
|---|
| TryLysC MShigh |
 |
|---|
General Statistics
Number of major isoforms |
Number of additional isoforms |
Number of all proteins |
Number of amino acids |
Min. Seq. Length |
Max. Seq. Length |
Avg. Seq. Length |
Avg. Mol. Weight |
|---|---|---|---|---|---|---|---|
0 |
750 |
108 |
394 |
250.0 |
27.84 |
Amino acid frequency
Ala |
Cys |
Asp |
Glu |
Phe |
Gly |
His |
Ile |
Lys |
Leu |
|---|---|---|---|---|---|---|---|---|---|
7.067 ± 0.65 | 1.6 ± 0.195 |
4.933 ± 0.665 | 4.667 ± 0.812 |
3.867 ± 0.214 | 6.8 ± 2.077 |
2.267 ± 0.472 | 5.467 ± 1.087 |
5.6 ± 0.935 | 6.0 ± 0.856 |
Met |
Asn |
Gln |
Pro |
Arg |
Ser |
Thr |
Val |
Trp |
Tyr |
|---|---|---|---|---|---|---|---|---|---|
1.733 ± 0.173 | 4.0 ± 0.969 |
6.667 ± 0.69 | 3.733 ± 0.721 |
5.6 ± 1.525 | 9.067 ± 0.643 |
7.867 ± 0.678 | 6.933 ± 1.91 |
2.267 ± 0.342 | 3.867 ± 0.703 |
Most of the basic statistics you can see at this page can be downloaded from this CSV file
Proteome-pI is available under Creative Commons Attribution-NoDerivs license, for more details see here
| Reference: Kozlowski LP. Proteome-pI 2.0: Proteome Isoelectric Point Database Update. Nucleic Acids Res. 2021, doi: 10.1093/nar/gkab944 | Contact: Lukasz P. Kozlowski |
