Proteus penneri ATCC 35198
Taxonomy: cellular organisms; Bacteria; Proteobacteria; Gammaproteobacteria; Enterobacterales; Morganellaceae; Proteus; Proteus penneri
Average proteome isoelectric point is 6.67
Get precalculated fractions of proteins

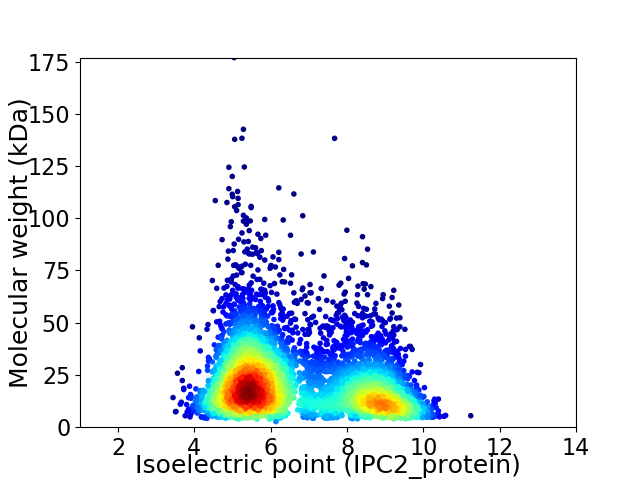
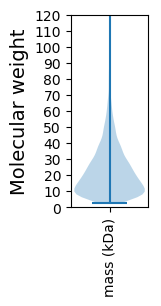
Virtual 2D-PAGE plot for 4909 proteins (isoelectric point calculated using IPC2_protein)
Get csv file with sequences according to given criteria:
* You can choose from 21 different methods for calculating isoelectric point
Summary statistics related to proteome-wise predictions


Protein with the lowest isoelectric point:
>tr|C0AY89|C0AY89_9GAMM Transporter DASS family OS=Proteus penneri ATCC 35198 OX=471881 GN=PROPEN_02812 PE=4 SV=1
MM1 pKa = 8.32DD2 pKa = 6.26PLTPQLMDD10 pKa = 3.15ICAIQEE16 pKa = 4.18TYY18 pKa = 10.3GQNKK22 pKa = 7.12ATRR25 pKa = 11.84IGNTIYY31 pKa = 10.89GFNSNTKK38 pKa = 9.56KK39 pKa = 10.56DD40 pKa = 3.87YY41 pKa = 11.12YY42 pKa = 10.52SLKK45 pKa = 9.45TSEE48 pKa = 4.65DD49 pKa = 3.8KK50 pKa = 10.82IVACIWDD57 pKa = 3.55TGGIDD62 pKa = 3.33TLDD65 pKa = 3.51FSKK68 pKa = 10.3YY69 pKa = 9.15TVDD72 pKa = 4.73QKK74 pKa = 11.25IDD76 pKa = 3.71LNEE79 pKa = 4.14GSFSDD84 pKa = 4.56VGGLRR89 pKa = 11.84ANISIAYY96 pKa = 9.3DD97 pKa = 3.47AVIEE101 pKa = 4.0NAIGGSQTDD110 pKa = 3.98IISGNDD116 pKa = 3.0ANNRR120 pKa = 11.84LFGKK124 pKa = 10.34LGEE127 pKa = 4.26DD128 pKa = 3.12TLYY131 pKa = 11.29GKK133 pKa = 10.49GGNDD137 pKa = 2.88ILYY140 pKa = 10.0GGQGNDD146 pKa = 2.96HH147 pKa = 7.07LYY149 pKa = 10.95GEE151 pKa = 4.82KK152 pKa = 11.02GNDD155 pKa = 3.39YY156 pKa = 10.97LYY158 pKa = 11.15GEE160 pKa = 4.37QDD162 pKa = 2.98NDD164 pKa = 3.65VLVDD168 pKa = 3.69SDD170 pKa = 5.23GNDD173 pKa = 3.27HH174 pKa = 7.24LYY176 pKa = 10.93GGQGDD181 pKa = 4.34DD182 pKa = 4.18YY183 pKa = 11.23LWDD186 pKa = 3.85SEE188 pKa = 4.52GDD190 pKa = 3.69NILDD194 pKa = 4.02GGLGDD199 pKa = 5.06DD200 pKa = 4.34VLFGGDD206 pKa = 5.25GDD208 pKa = 5.07DD209 pKa = 4.03EE210 pKa = 5.36LNGGEE215 pKa = 4.76GNDD218 pKa = 3.91HH219 pKa = 7.47LDD221 pKa = 3.48PGMGNNTLKK230 pKa = 11.02GGTGYY235 pKa = 8.59DD236 pKa = 3.03TFSFNTQDD244 pKa = 3.51NDD246 pKa = 3.2SSNIITDD253 pKa = 4.3FEE255 pKa = 4.64SGIDD259 pKa = 3.43KK260 pKa = 11.02LFFLL264 pKa = 5.49
MM1 pKa = 8.32DD2 pKa = 6.26PLTPQLMDD10 pKa = 3.15ICAIQEE16 pKa = 4.18TYY18 pKa = 10.3GQNKK22 pKa = 7.12ATRR25 pKa = 11.84IGNTIYY31 pKa = 10.89GFNSNTKK38 pKa = 9.56KK39 pKa = 10.56DD40 pKa = 3.87YY41 pKa = 11.12YY42 pKa = 10.52SLKK45 pKa = 9.45TSEE48 pKa = 4.65DD49 pKa = 3.8KK50 pKa = 10.82IVACIWDD57 pKa = 3.55TGGIDD62 pKa = 3.33TLDD65 pKa = 3.51FSKK68 pKa = 10.3YY69 pKa = 9.15TVDD72 pKa = 4.73QKK74 pKa = 11.25IDD76 pKa = 3.71LNEE79 pKa = 4.14GSFSDD84 pKa = 4.56VGGLRR89 pKa = 11.84ANISIAYY96 pKa = 9.3DD97 pKa = 3.47AVIEE101 pKa = 4.0NAIGGSQTDD110 pKa = 3.98IISGNDD116 pKa = 3.0ANNRR120 pKa = 11.84LFGKK124 pKa = 10.34LGEE127 pKa = 4.26DD128 pKa = 3.12TLYY131 pKa = 11.29GKK133 pKa = 10.49GGNDD137 pKa = 2.88ILYY140 pKa = 10.0GGQGNDD146 pKa = 2.96HH147 pKa = 7.07LYY149 pKa = 10.95GEE151 pKa = 4.82KK152 pKa = 11.02GNDD155 pKa = 3.39YY156 pKa = 10.97LYY158 pKa = 11.15GEE160 pKa = 4.37QDD162 pKa = 2.98NDD164 pKa = 3.65VLVDD168 pKa = 3.69SDD170 pKa = 5.23GNDD173 pKa = 3.27HH174 pKa = 7.24LYY176 pKa = 10.93GGQGDD181 pKa = 4.34DD182 pKa = 4.18YY183 pKa = 11.23LWDD186 pKa = 3.85SEE188 pKa = 4.52GDD190 pKa = 3.69NILDD194 pKa = 4.02GGLGDD199 pKa = 5.06DD200 pKa = 4.34VLFGGDD206 pKa = 5.25GDD208 pKa = 5.07DD209 pKa = 4.03EE210 pKa = 5.36LNGGEE215 pKa = 4.76GNDD218 pKa = 3.91HH219 pKa = 7.47LDD221 pKa = 3.48PGMGNNTLKK230 pKa = 11.02GGTGYY235 pKa = 8.59DD236 pKa = 3.03TFSFNTQDD244 pKa = 3.51NDD246 pKa = 3.2SSNIITDD253 pKa = 4.3FEE255 pKa = 4.64SGIDD259 pKa = 3.43KK260 pKa = 11.02LFFLL264 pKa = 5.49
Molecular weight: 28.48 kDa
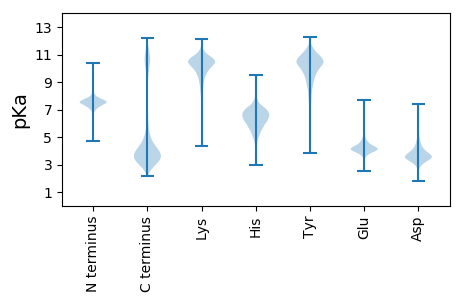
Isoelectric point according different methods:
Protein with the highest isoelectric point:
>tr|C0ASR5|C0ASR5_9GAMM Glutamine--fructose-6-phosphate transaminase (Isomerizing) OS=Proteus penneri ATCC 35198 OX=471881 GN=PROPEN_00846 PE=4 SV=1
MM1 pKa = 7.45KK2 pKa = 9.51RR3 pKa = 11.84TFQPSVLKK11 pKa = 10.65RR12 pKa = 11.84NRR14 pKa = 11.84NHH16 pKa = 6.8GFRR19 pKa = 11.84ARR21 pKa = 11.84MATKK25 pKa = 10.4NGRR28 pKa = 11.84QVLARR33 pKa = 11.84RR34 pKa = 11.84RR35 pKa = 11.84AKK37 pKa = 10.22GRR39 pKa = 11.84ARR41 pKa = 11.84LTVSSKK47 pKa = 11.16
MM1 pKa = 7.45KK2 pKa = 9.51RR3 pKa = 11.84TFQPSVLKK11 pKa = 10.65RR12 pKa = 11.84NRR14 pKa = 11.84NHH16 pKa = 6.8GFRR19 pKa = 11.84ARR21 pKa = 11.84MATKK25 pKa = 10.4NGRR28 pKa = 11.84QVLARR33 pKa = 11.84RR34 pKa = 11.84RR35 pKa = 11.84AKK37 pKa = 10.22GRR39 pKa = 11.84ARR41 pKa = 11.84LTVSSKK47 pKa = 11.16
Molecular weight: 5.49 kDa
Isoelectric point according different methods:
Peptides (in silico digests for buttom-up proteomics)
Below you can find in silico digests of the whole proteome with Trypsin, Chymotrypsin, Trypsin+LysC, LysN, ArgC proteases suitable for different mass spec machines.| Try ESI |
 |
|---|
| ChTry ESI |
 |
|---|
| ArgC ESI |
 |
|---|
| LysN ESI |
 |
|---|
| TryLysC ESI |
 |
|---|
| Try MALDI |
 |
|---|
| ChTry MALDI |
 |
|---|
| ArgC MALDI |
 |
|---|
| LysN MALDI |
 |
|---|
| TryLysC MALDI |
 |
|---|
| Try LTQ |
 |
|---|
| ChTry LTQ |
 |
|---|
| ArgC LTQ |
 |
|---|
| LysN LTQ |
 |
|---|
| TryLysC LTQ |
 |
|---|
| Try MSlow |
 |
|---|
| ChTry MSlow |
 |
|---|
| ArgC MSlow |
 |
|---|
| LysN MSlow |
 |
|---|
| TryLysC MSlow |
 |
|---|
| Try MShigh |
 |
|---|
| ChTry MShigh |
 |
|---|
| ArgC MShigh |
 |
|---|
| LysN MShigh |
 |
|---|
| TryLysC MShigh |
 |
|---|
General Statistics
Number of major isoforms |
Number of additional isoforms |
Number of all proteins |
Number of amino acids |
Min. Seq. Length |
Max. Seq. Length |
Avg. Seq. Length |
Avg. Mol. Weight |
|---|---|---|---|---|---|---|---|
0 |
1040949 |
24 |
1676 |
212.0 |
23.7 |
Amino acid frequency
Ala |
Cys |
Asp |
Glu |
Phe |
Gly |
His |
Ile |
Lys |
Leu |
|---|---|---|---|---|---|---|---|---|---|
7.978 ± 0.038 | 1.106 ± 0.015 |
5.107 ± 0.029 | 5.958 ± 0.038 |
4.165 ± 0.032 | 6.684 ± 0.038 |
2.148 ± 0.019 | 7.313 ± 0.035 |
5.689 ± 0.037 | 10.427 ± 0.04 |
Met |
Asn |
Gln |
Pro |
Arg |
Ser |
Thr |
Val |
Trp |
Tyr |
|---|---|---|---|---|---|---|---|---|---|
2.766 ± 0.02 | 4.762 ± 0.033 |
3.996 ± 0.024 | 4.442 ± 0.037 |
4.657 ± 0.033 | 6.425 ± 0.031 |
5.451 ± 0.025 | 6.393 ± 0.031 |
1.279 ± 0.015 | 3.255 ± 0.028 |
Most of the basic statistics you can see at this page can be downloaded from this CSV file
Proteome-pI is available under Creative Commons Attribution-NoDerivs license, for more details see here
| Reference: Kozlowski LP. Proteome-pI 2.0: Proteome Isoelectric Point Database Update. Nucleic Acids Res. 2021, doi: 10.1093/nar/gkab944 | Contact: Lukasz P. Kozlowski |
