Minicystis rosea
Taxonomy: cellular organisms; Bacteria; Proteobacteria; delta/epsilon subdivisions; Deltaproteobacteria; Myxococcales; Sorangiineae; Sorangiineae incertae sedis; Minicystis
Average proteome isoelectric point is 6.79
Get precalculated fractions of proteins

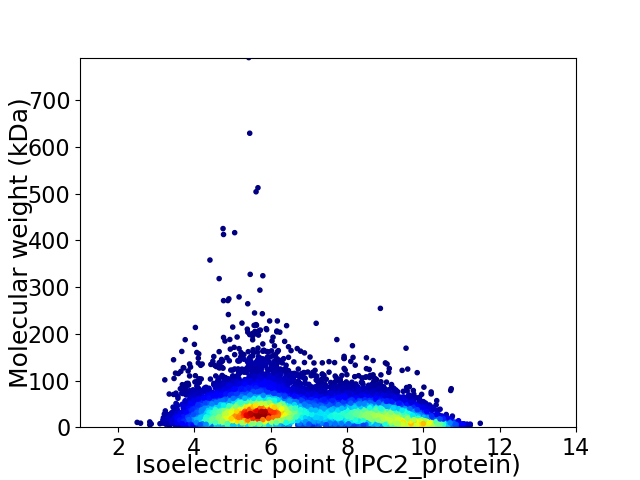
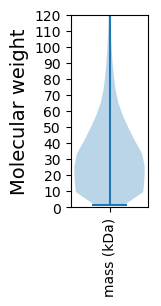
Virtual 2D-PAGE plot for 13965 proteins (isoelectric point calculated using IPC2_protein)
Get csv file with sequences according to given criteria:
* You can choose from 21 different methods for calculating isoelectric point
Summary statistics related to proteome-wise predictions


Protein with the lowest isoelectric point:
>tr|A0A1L6LUT3|A0A1L6LUT3_9DELT Uncharacterized protein OS=Minicystis rosea OX=888845 GN=A7982_10747 PE=4 SV=1
MM1 pKa = 8.11DD2 pKa = 4.19ISIRR6 pKa = 11.84AICGGLGVAALVAACSANGGGNVFTSSDD34 pKa = 3.67GDD36 pKa = 3.58TGGAGHH42 pKa = 7.12GGSATGTKK50 pKa = 8.84STGTGAGDD58 pKa = 3.35VGGGDD63 pKa = 3.22ISFTTSGTGTGTGNTCNHH81 pKa = 6.48APDD84 pKa = 4.71ADD86 pKa = 3.92GDD88 pKa = 4.32GDD90 pKa = 3.61GWTANEE96 pKa = 4.67GDD98 pKa = 5.48CNDD101 pKa = 4.47CDD103 pKa = 4.24PNVNPGAIEE112 pKa = 4.31VVATDD117 pKa = 4.5PNAPPADD124 pKa = 4.13EE125 pKa = 5.25NCDD128 pKa = 3.37GMIDD132 pKa = 3.91NVEE135 pKa = 4.19PTCDD139 pKa = 4.43DD140 pKa = 3.85GLALDD145 pKa = 5.51DD146 pKa = 4.23VNPLNGARR154 pKa = 11.84AVDD157 pKa = 3.66LCKK160 pKa = 10.05IAEE163 pKa = 4.14EE164 pKa = 4.62TPASKK169 pKa = 10.24KK170 pKa = 10.63DD171 pKa = 3.56KK172 pKa = 8.39TWGVIGAQYY181 pKa = 10.65VRR183 pKa = 11.84ANGTAYY189 pKa = 10.02AAPGYY194 pKa = 9.93QVGLQAGWGPNVHH207 pKa = 6.34PQGGTKK213 pKa = 9.1MLAISSGRR221 pKa = 11.84ARR223 pKa = 11.84LPGQTGEE230 pKa = 4.9CGDD233 pKa = 3.94NSCPNNSPGQAPPGFPQDD251 pKa = 3.33VAGCDD256 pKa = 3.42GSTVIKK262 pKa = 10.61DD263 pKa = 3.63DD264 pKa = 3.34VALQVKK270 pKa = 9.65IRR272 pKa = 11.84TPTNATGYY280 pKa = 9.89SFAFNFYY287 pKa = 9.97SFEE290 pKa = 4.11YY291 pKa = 10.35PEE293 pKa = 4.55FVCTLFNDD301 pKa = 3.79QFISLVDD308 pKa = 3.57PAPNGSVSGNISFDD322 pKa = 4.02SNHH325 pKa = 5.91NPVSVNVAFFNVCDD339 pKa = 4.02PCPLGTAQLAGTGFDD354 pKa = 3.82GAWYY358 pKa = 9.74DD359 pKa = 4.65DD360 pKa = 3.84GGATGWLKK368 pKa = 10.79SQAPVKK374 pKa = 10.34GGDD377 pKa = 3.47VITIRR382 pKa = 11.84WTIWDD387 pKa = 4.26TGDD390 pKa = 3.85QSWDD394 pKa = 3.15STALVDD400 pKa = 4.07NFQWIANGGTVSVGTDD416 pKa = 4.32PINMPKK422 pKa = 10.47
MM1 pKa = 8.11DD2 pKa = 4.19ISIRR6 pKa = 11.84AICGGLGVAALVAACSANGGGNVFTSSDD34 pKa = 3.67GDD36 pKa = 3.58TGGAGHH42 pKa = 7.12GGSATGTKK50 pKa = 8.84STGTGAGDD58 pKa = 3.35VGGGDD63 pKa = 3.22ISFTTSGTGTGTGNTCNHH81 pKa = 6.48APDD84 pKa = 4.71ADD86 pKa = 3.92GDD88 pKa = 4.32GDD90 pKa = 3.61GWTANEE96 pKa = 4.67GDD98 pKa = 5.48CNDD101 pKa = 4.47CDD103 pKa = 4.24PNVNPGAIEE112 pKa = 4.31VVATDD117 pKa = 4.5PNAPPADD124 pKa = 4.13EE125 pKa = 5.25NCDD128 pKa = 3.37GMIDD132 pKa = 3.91NVEE135 pKa = 4.19PTCDD139 pKa = 4.43DD140 pKa = 3.85GLALDD145 pKa = 5.51DD146 pKa = 4.23VNPLNGARR154 pKa = 11.84AVDD157 pKa = 3.66LCKK160 pKa = 10.05IAEE163 pKa = 4.14EE164 pKa = 4.62TPASKK169 pKa = 10.24KK170 pKa = 10.63DD171 pKa = 3.56KK172 pKa = 8.39TWGVIGAQYY181 pKa = 10.65VRR183 pKa = 11.84ANGTAYY189 pKa = 10.02AAPGYY194 pKa = 9.93QVGLQAGWGPNVHH207 pKa = 6.34PQGGTKK213 pKa = 9.1MLAISSGRR221 pKa = 11.84ARR223 pKa = 11.84LPGQTGEE230 pKa = 4.9CGDD233 pKa = 3.94NSCPNNSPGQAPPGFPQDD251 pKa = 3.33VAGCDD256 pKa = 3.42GSTVIKK262 pKa = 10.61DD263 pKa = 3.63DD264 pKa = 3.34VALQVKK270 pKa = 9.65IRR272 pKa = 11.84TPTNATGYY280 pKa = 9.89SFAFNFYY287 pKa = 9.97SFEE290 pKa = 4.11YY291 pKa = 10.35PEE293 pKa = 4.55FVCTLFNDD301 pKa = 3.79QFISLVDD308 pKa = 3.57PAPNGSVSGNISFDD322 pKa = 4.02SNHH325 pKa = 5.91NPVSVNVAFFNVCDD339 pKa = 4.02PCPLGTAQLAGTGFDD354 pKa = 3.82GAWYY358 pKa = 9.74DD359 pKa = 4.65DD360 pKa = 3.84GGATGWLKK368 pKa = 10.79SQAPVKK374 pKa = 10.34GGDD377 pKa = 3.47VITIRR382 pKa = 11.84WTIWDD387 pKa = 4.26TGDD390 pKa = 3.85QSWDD394 pKa = 3.15STALVDD400 pKa = 4.07NFQWIANGGTVSVGTDD416 pKa = 4.32PINMPKK422 pKa = 10.47
Molecular weight: 42.87 kDa
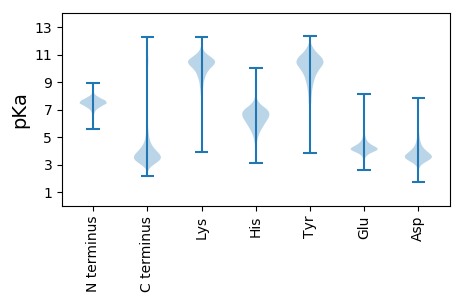
Isoelectric point according different methods:
Protein with the highest isoelectric point:
>tr|A0A1L6LM60|A0A1L6LM60_9DELT Uncharacterized protein OS=Minicystis rosea OX=888845 GN=A7982_08214 PE=4 SV=1
MM1 pKa = 7.53HH2 pKa = 7.62GAPSWSGRR10 pKa = 11.84GRR12 pKa = 11.84PARR15 pKa = 11.84SVLPSPPMIVWATLPSKK32 pKa = 10.66ARR34 pKa = 11.84PARR37 pKa = 11.84SAPPPRR43 pKa = 11.84SRR45 pKa = 11.84RR46 pKa = 11.84TPGKK50 pKa = 9.86RR51 pKa = 11.84RR52 pKa = 11.84AAAMAASRR60 pKa = 11.84PP61 pKa = 3.9
MM1 pKa = 7.53HH2 pKa = 7.62GAPSWSGRR10 pKa = 11.84GRR12 pKa = 11.84PARR15 pKa = 11.84SVLPSPPMIVWATLPSKK32 pKa = 10.66ARR34 pKa = 11.84PARR37 pKa = 11.84SAPPPRR43 pKa = 11.84SRR45 pKa = 11.84RR46 pKa = 11.84TPGKK50 pKa = 9.86RR51 pKa = 11.84RR52 pKa = 11.84AAAMAASRR60 pKa = 11.84PP61 pKa = 3.9
Molecular weight: 6.51 kDa
Isoelectric point according different methods:
Peptides (in silico digests for buttom-up proteomics)
Below you can find in silico digests of the whole proteome with Trypsin, Chymotrypsin, Trypsin+LysC, LysN, ArgC proteases suitable for different mass spec machines.| Try ESI |
 |
|---|
| ChTry ESI |
 |
|---|
| ArgC ESI |
 |
|---|
| LysN ESI |
 |
|---|
| TryLysC ESI |
 |
|---|
| Try MALDI |
 |
|---|
| ChTry MALDI |
 |
|---|
| ArgC MALDI |
 |
|---|
| LysN MALDI |
 |
|---|
| TryLysC MALDI |
 |
|---|
| Try LTQ |
 |
|---|
| ChTry LTQ |
 |
|---|
| ArgC LTQ |
 |
|---|
| LysN LTQ |
 |
|---|
| TryLysC LTQ |
 |
|---|
| Try MSlow |
 |
|---|
| ChTry MSlow |
 |
|---|
| ArgC MSlow |
 |
|---|
| LysN MSlow |
 |
|---|
| TryLysC MSlow |
 |
|---|
| Try MShigh |
 |
|---|
| ChTry MShigh |
 |
|---|
| ArgC MShigh |
 |
|---|
| LysN MShigh |
 |
|---|
| TryLysC MShigh |
 |
|---|
General Statistics
Number of major isoforms |
Number of additional isoforms |
Number of all proteins |
Number of amino acids |
Min. Seq. Length |
Max. Seq. Length |
Avg. Seq. Length |
Avg. Mol. Weight |
|---|---|---|---|---|---|---|---|
0 |
4652819 |
14 |
7371 |
333.2 |
35.7 |
Amino acid frequency
Ala |
Cys |
Asp |
Glu |
Phe |
Gly |
His |
Ile |
Lys |
Leu |
|---|---|---|---|---|---|---|---|---|---|
13.686 ± 0.041 | 1.319 ± 0.018 |
5.848 ± 0.017 | 5.681 ± 0.022 |
3.157 ± 0.012 | 8.959 ± 0.027 |
2.196 ± 0.012 | 3.915 ± 0.012 |
2.817 ± 0.018 | 9.524 ± 0.025 |
Met |
Asn |
Gln |
Pro |
Arg |
Ser |
Thr |
Val |
Trp |
Tyr |
|---|---|---|---|---|---|---|---|---|---|
1.868 ± 0.009 | 1.984 ± 0.015 |
6.322 ± 0.023 | 2.552 ± 0.011 |
7.994 ± 0.034 | 5.812 ± 0.019 |
5.491 ± 0.017 | 7.655 ± 0.018 |
1.297 ± 0.008 | 1.924 ± 0.012 |
Most of the basic statistics you can see at this page can be downloaded from this CSV file
Proteome-pI is available under Creative Commons Attribution-NoDerivs license, for more details see here
| Reference: Kozlowski LP. Proteome-pI 2.0: Proteome Isoelectric Point Database Update. Nucleic Acids Res. 2021, doi: 10.1093/nar/gkab944 | Contact: Lukasz P. Kozlowski |
