Mint virus X
Taxonomy: Viruses; Riboviria; Orthornavirae; Kitrinoviricota; Alsuviricetes; Tymovirales; Alphaflexiviridae; Potexvirus
Average proteome isoelectric point is 7.01
Get precalculated fractions of proteins

Virtual 2D-PAGE plot for 5 proteins (isoelectric point calculated using IPC2_protein)
Get csv file with sequences according to given criteria:
* You can choose from 21 different methods for calculating isoelectric point
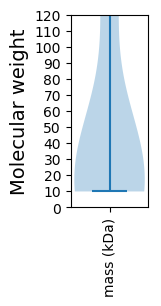
Summary statistics related to proteome-wise predictions


Protein with the lowest isoelectric point:
>tr|Q5G7H3|Q5G7H3_9VIRU ORF1 protein OS=Mint virus X OX=301865 PE=4 SV=1
MM1 pKa = 7.95DD2 pKa = 4.7SYY4 pKa = 11.1RR5 pKa = 11.84AEE7 pKa = 3.97LASAFTRR14 pKa = 11.84TSLPLSKK21 pKa = 10.08PIVVHH26 pKa = 5.75TVAGAGKK33 pKa = 6.94TTFIRR38 pKa = 11.84RR39 pKa = 11.84LIRR42 pKa = 11.84HH43 pKa = 6.19APFPTAITGGTPDD56 pKa = 4.29PPHH59 pKa = 7.31ISGQRR64 pKa = 11.84ITAPPGPANIVDD76 pKa = 4.82EE77 pKa = 4.62YY78 pKa = 11.01PLVDD82 pKa = 3.17WAGADD87 pKa = 3.93VIFADD92 pKa = 4.37PLQHH96 pKa = 7.37RR97 pKa = 11.84GPTLPAHH104 pKa = 5.12YY105 pKa = 8.91TSSITHH111 pKa = 6.35RR112 pKa = 11.84FGRR115 pKa = 11.84ATCEE119 pKa = 3.88LLSKK123 pKa = 10.7FGITAEE129 pKa = 4.21SNKK132 pKa = 9.72EE133 pKa = 3.82DD134 pKa = 3.35EE135 pKa = 5.39VFFGWAFADD144 pKa = 3.97DD145 pKa = 4.09PEE147 pKa = 5.07GAVICLDD154 pKa = 4.39AEE156 pKa = 4.33AQSLASWNGLEE167 pKa = 4.41HH168 pKa = 7.19LKK170 pKa = 10.58PCEE173 pKa = 3.76ALGATFPVVTVISGTPLEE191 pKa = 4.5EE192 pKa = 4.94ADD194 pKa = 4.07AVDD197 pKa = 4.95RR198 pKa = 11.84YY199 pKa = 10.3IALTRR204 pKa = 11.84HH205 pKa = 4.8TRR207 pKa = 11.84LLRR210 pKa = 11.84ILLL213 pKa = 4.1
MM1 pKa = 7.95DD2 pKa = 4.7SYY4 pKa = 11.1RR5 pKa = 11.84AEE7 pKa = 3.97LASAFTRR14 pKa = 11.84TSLPLSKK21 pKa = 10.08PIVVHH26 pKa = 5.75TVAGAGKK33 pKa = 6.94TTFIRR38 pKa = 11.84RR39 pKa = 11.84LIRR42 pKa = 11.84HH43 pKa = 6.19APFPTAITGGTPDD56 pKa = 4.29PPHH59 pKa = 7.31ISGQRR64 pKa = 11.84ITAPPGPANIVDD76 pKa = 4.82EE77 pKa = 4.62YY78 pKa = 11.01PLVDD82 pKa = 3.17WAGADD87 pKa = 3.93VIFADD92 pKa = 4.37PLQHH96 pKa = 7.37RR97 pKa = 11.84GPTLPAHH104 pKa = 5.12YY105 pKa = 8.91TSSITHH111 pKa = 6.35RR112 pKa = 11.84FGRR115 pKa = 11.84ATCEE119 pKa = 3.88LLSKK123 pKa = 10.7FGITAEE129 pKa = 4.21SNKK132 pKa = 9.72EE133 pKa = 3.82DD134 pKa = 3.35EE135 pKa = 5.39VFFGWAFADD144 pKa = 3.97DD145 pKa = 4.09PEE147 pKa = 5.07GAVICLDD154 pKa = 4.39AEE156 pKa = 4.33AQSLASWNGLEE167 pKa = 4.41HH168 pKa = 7.19LKK170 pKa = 10.58PCEE173 pKa = 3.76ALGATFPVVTVISGTPLEE191 pKa = 4.5EE192 pKa = 4.94ADD194 pKa = 4.07AVDD197 pKa = 4.95RR198 pKa = 11.84YY199 pKa = 10.3IALTRR204 pKa = 11.84HH205 pKa = 4.8TRR207 pKa = 11.84LLRR210 pKa = 11.84ILLL213 pKa = 4.1
Molecular weight: 23.02 kDa
Isoelectric point according different methods:
Protein with the highest isoelectric point:
>tr|Q5G7H2|Q5G7H2_9VIRU TGB 1 OS=Mint virus X OX=301865 PE=4 SV=1
MM1 pKa = 7.71PLAPPPDD8 pKa = 3.66YY9 pKa = 11.12SKK11 pKa = 11.5AVLAVAVGLAAALLVHH27 pKa = 6.09QLTRR31 pKa = 11.84STLPHH36 pKa = 6.48SGDD39 pKa = 4.36NIHH42 pKa = 6.58SLPFGGSYY50 pKa = 11.07VDD52 pKa = 3.39GTKK55 pKa = 10.12RR56 pKa = 11.84IHH58 pKa = 6.63FGGPSRR64 pKa = 11.84GSSGHH69 pKa = 6.26LWLPALIVAILPGIIWLGRR88 pKa = 11.84PRR90 pKa = 11.84AAHH93 pKa = 5.53VCRR96 pKa = 11.84CPLCAAARR104 pKa = 11.84PPP106 pKa = 3.45
MM1 pKa = 7.71PLAPPPDD8 pKa = 3.66YY9 pKa = 11.12SKK11 pKa = 11.5AVLAVAVGLAAALLVHH27 pKa = 6.09QLTRR31 pKa = 11.84STLPHH36 pKa = 6.48SGDD39 pKa = 4.36NIHH42 pKa = 6.58SLPFGGSYY50 pKa = 11.07VDD52 pKa = 3.39GTKK55 pKa = 10.12RR56 pKa = 11.84IHH58 pKa = 6.63FGGPSRR64 pKa = 11.84GSSGHH69 pKa = 6.26LWLPALIVAILPGIIWLGRR88 pKa = 11.84PRR90 pKa = 11.84AAHH93 pKa = 5.53VCRR96 pKa = 11.84CPLCAAARR104 pKa = 11.84PPP106 pKa = 3.45
Molecular weight: 11.05 kDa
Isoelectric point according different methods:
Peptides (in silico digests for buttom-up proteomics)
Below you can find in silico digests of the whole proteome with Trypsin, Chymotrypsin, Trypsin+LysC, LysN, ArgC proteases suitable for different mass spec machines.| Try ESI |
 |
|---|
| ChTry ESI |
 |
|---|
| ArgC ESI |
 |
|---|
| LysN ESI |
 |
|---|
| TryLysC ESI |
 |
|---|
| Try MALDI |
 |
|---|
| ChTry MALDI |
 |
|---|
| ArgC MALDI |
 |
|---|
| LysN MALDI |
 |
|---|
| TryLysC MALDI |
 |
|---|
| Try LTQ |
 |
|---|
| ChTry LTQ |
 |
|---|
| ArgC LTQ |
 |
|---|
| LysN LTQ |
 |
|---|
| TryLysC LTQ |
 |
|---|
| Try MSlow |
 |
|---|
| ChTry MSlow |
 |
|---|
| ArgC MSlow |
 |
|---|
| LysN MSlow |
 |
|---|
| TryLysC MSlow |
 |
|---|
| Try MShigh |
 |
|---|
| ChTry MShigh |
 |
|---|
| ArgC MShigh |
 |
|---|
| LysN MShigh |
 |
|---|
| TryLysC MShigh |
 |
|---|
General Statistics
Number of major isoforms |
Number of additional isoforms |
Number of all proteins |
Number of amino acids |
Min. Seq. Length |
Max. Seq. Length |
Avg. Seq. Length |
Avg. Mol. Weight |
|---|---|---|---|---|---|---|---|
0 |
1954 |
95 |
1312 |
390.8 |
43.21 |
Amino acid frequency
Ala |
Cys |
Asp |
Glu |
Phe |
Gly |
His |
Ile |
Lys |
Leu |
|---|---|---|---|---|---|---|---|---|---|
10.798 ± 2.794 | 1.791 ± 0.378 |
5.578 ± 0.842 | 4.964 ± 1.213 |
5.015 ± 0.529 | 5.629 ± 1.427 |
3.992 ± 0.413 | 4.759 ± 0.562 |
4.094 ± 1.031 | 10.287 ± 0.732 |
Met |
Asn |
Gln |
Pro |
Arg |
Ser |
Thr |
Val |
Trp |
Tyr |
|---|---|---|---|---|---|---|---|---|---|
1.586 ± 0.441 | 2.508 ± 0.631 |
7.216 ± 0.99 | 3.531 ± 1.114 |
5.681 ± 0.217 | 6.397 ± 0.559 |
7.062 ± 0.754 | 5.322 ± 0.328 |
1.331 ± 0.095 | 2.456 ± 0.488 |
Most of the basic statistics you can see at this page can be downloaded from this CSV file
Proteome-pI is available under Creative Commons Attribution-NoDerivs license, for more details see here
| Reference: Kozlowski LP. Proteome-pI 2.0: Proteome Isoelectric Point Database Update. Nucleic Acids Res. 2021, doi: 10.1093/nar/gkab944 | Contact: Lukasz P. Kozlowski |
