Subdoligranulum sp. APC924/74
Taxonomy: cellular organisms; Bacteria; Terrabacteria group; Firmicutes; Clostridia; Eubacteriales; Oscillospiraceae; Subdoligranulum; unclassified Subdoligranulum
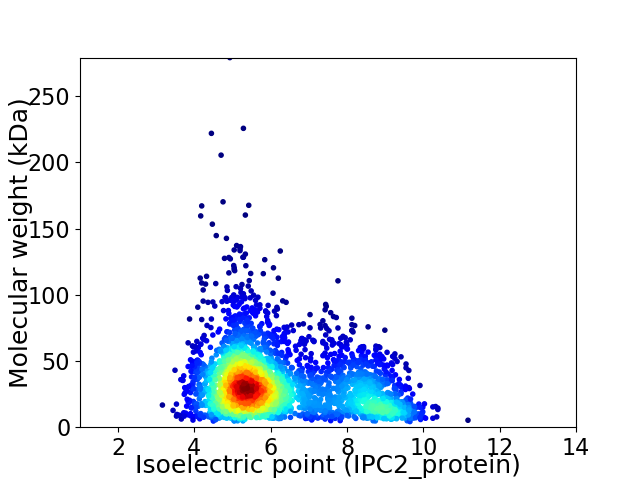
Average proteome isoelectric point is 6.23
Get precalculated fractions of proteins

Virtual 2D-PAGE plot for 3080 proteins (isoelectric point calculated using IPC2_protein)
Get csv file with sequences according to given criteria:
* You can choose from 21 different methods for calculating isoelectric point
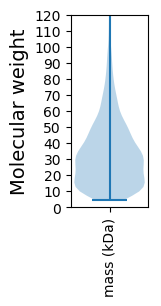
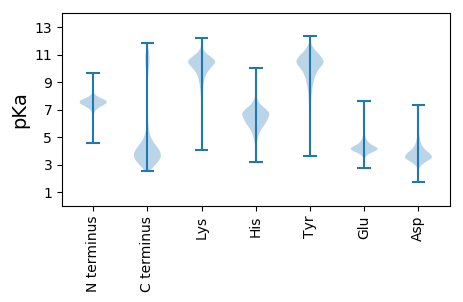
Summary statistics related to proteome-wise predictions


Protein with the lowest isoelectric point:
>tr|A0A367FT45|A0A367FT45_9FIRM Uncharacterized protein OS=Subdoligranulum sp. APC924/74 OX=2086273 GN=C4885_16080 PE=4 SV=1
MM1 pKa = 6.92KK2 pKa = 10.08QNRR5 pKa = 11.84VISGAVAALVLAALLAGCGSTATGASSADD34 pKa = 3.43STPAATEE41 pKa = 3.96AASSEE46 pKa = 4.1ATAPTAEE53 pKa = 4.43PQTEE57 pKa = 3.9AALPDD62 pKa = 3.72GVYY65 pKa = 9.22TAEE68 pKa = 4.33FEE70 pKa = 4.52TDD72 pKa = 2.72SSMVHH77 pKa = 6.58ANEE80 pKa = 4.13ACDD83 pKa = 3.83GKK85 pKa = 10.51GTLTVADD92 pKa = 4.13GKK94 pKa = 8.53MTFHH98 pKa = 7.15VSLASKK104 pKa = 10.51KK105 pKa = 9.96IVNLYY110 pKa = 10.63LGTAEE115 pKa = 4.95DD116 pKa = 4.44APSHH120 pKa = 5.79EE121 pKa = 4.95SDD123 pKa = 2.86WLQPTTDD130 pKa = 3.25TVTYY134 pKa = 10.95SDD136 pKa = 3.66GTSDD140 pKa = 3.21EE141 pKa = 4.6VYY143 pKa = 10.71GYY145 pKa = 9.77DD146 pKa = 3.69IPLDD150 pKa = 3.87AVDD153 pKa = 4.82TDD155 pKa = 3.91FQLAILGTKK164 pKa = 7.28GTWYY168 pKa = 10.34DD169 pKa = 3.19HH170 pKa = 5.57TVSVRR175 pKa = 11.84NAEE178 pKa = 4.3PKK180 pKa = 10.17TEE182 pKa = 4.07DD183 pKa = 3.4AAAEE187 pKa = 4.16TAAVPADD194 pKa = 3.56GSYY197 pKa = 9.41TCAVTLEE204 pKa = 4.62GGSGRR209 pKa = 11.84ATVEE213 pKa = 3.97SPAALTVADD222 pKa = 3.92GTMTAVIVWSSPNYY236 pKa = 10.75DD237 pKa = 3.28YY238 pKa = 11.29MLIDD242 pKa = 3.7GEE244 pKa = 5.1KK245 pKa = 9.66YY246 pKa = 10.77LPTNTEE252 pKa = 3.98GNSTFEE258 pKa = 4.18IPVAALDD265 pKa = 3.54TALAVTADD273 pKa = 4.21TVAMSTPHH281 pKa = 6.76EE282 pKa = 4.09IDD284 pKa = 3.17YY285 pKa = 9.82TLTFDD290 pKa = 4.96SATLTPAEE298 pKa = 4.16
MM1 pKa = 6.92KK2 pKa = 10.08QNRR5 pKa = 11.84VISGAVAALVLAALLAGCGSTATGASSADD34 pKa = 3.43STPAATEE41 pKa = 3.96AASSEE46 pKa = 4.1ATAPTAEE53 pKa = 4.43PQTEE57 pKa = 3.9AALPDD62 pKa = 3.72GVYY65 pKa = 9.22TAEE68 pKa = 4.33FEE70 pKa = 4.52TDD72 pKa = 2.72SSMVHH77 pKa = 6.58ANEE80 pKa = 4.13ACDD83 pKa = 3.83GKK85 pKa = 10.51GTLTVADD92 pKa = 4.13GKK94 pKa = 8.53MTFHH98 pKa = 7.15VSLASKK104 pKa = 10.51KK105 pKa = 9.96IVNLYY110 pKa = 10.63LGTAEE115 pKa = 4.95DD116 pKa = 4.44APSHH120 pKa = 5.79EE121 pKa = 4.95SDD123 pKa = 2.86WLQPTTDD130 pKa = 3.25TVTYY134 pKa = 10.95SDD136 pKa = 3.66GTSDD140 pKa = 3.21EE141 pKa = 4.6VYY143 pKa = 10.71GYY145 pKa = 9.77DD146 pKa = 3.69IPLDD150 pKa = 3.87AVDD153 pKa = 4.82TDD155 pKa = 3.91FQLAILGTKK164 pKa = 7.28GTWYY168 pKa = 10.34DD169 pKa = 3.19HH170 pKa = 5.57TVSVRR175 pKa = 11.84NAEE178 pKa = 4.3PKK180 pKa = 10.17TEE182 pKa = 4.07DD183 pKa = 3.4AAAEE187 pKa = 4.16TAAVPADD194 pKa = 3.56GSYY197 pKa = 9.41TCAVTLEE204 pKa = 4.62GGSGRR209 pKa = 11.84ATVEE213 pKa = 3.97SPAALTVADD222 pKa = 3.92GTMTAVIVWSSPNYY236 pKa = 10.75DD237 pKa = 3.28YY238 pKa = 11.29MLIDD242 pKa = 3.7GEE244 pKa = 5.1KK245 pKa = 9.66YY246 pKa = 10.77LPTNTEE252 pKa = 3.98GNSTFEE258 pKa = 4.18IPVAALDD265 pKa = 3.54TALAVTADD273 pKa = 4.21TVAMSTPHH281 pKa = 6.76EE282 pKa = 4.09IDD284 pKa = 3.17YY285 pKa = 9.82TLTFDD290 pKa = 4.96SATLTPAEE298 pKa = 4.16
Molecular weight: 30.75 kDa
Isoelectric point according different methods:
Protein with the highest isoelectric point:
>tr|A0A367GIY2|A0A367GIY2_9FIRM Uncharacterized protein OS=Subdoligranulum sp. APC924/74 OX=2086273 GN=C4885_04330 PE=4 SV=1
MM1 pKa = 7.31KK2 pKa = 9.52QTFQPKK8 pKa = 8.47KK9 pKa = 7.51RR10 pKa = 11.84QRR12 pKa = 11.84SRR14 pKa = 11.84VHH16 pKa = 6.33GFLKK20 pKa = 10.64RR21 pKa = 11.84MASKK25 pKa = 10.75NGRR28 pKa = 11.84KK29 pKa = 9.16VLARR33 pKa = 11.84RR34 pKa = 11.84RR35 pKa = 11.84AKK37 pKa = 10.01GRR39 pKa = 11.84KK40 pKa = 8.63NLTVV44 pKa = 3.1
MM1 pKa = 7.31KK2 pKa = 9.52QTFQPKK8 pKa = 8.47KK9 pKa = 7.51RR10 pKa = 11.84QRR12 pKa = 11.84SRR14 pKa = 11.84VHH16 pKa = 6.33GFLKK20 pKa = 10.64RR21 pKa = 11.84MASKK25 pKa = 10.75NGRR28 pKa = 11.84KK29 pKa = 9.16VLARR33 pKa = 11.84RR34 pKa = 11.84RR35 pKa = 11.84AKK37 pKa = 10.01GRR39 pKa = 11.84KK40 pKa = 8.63NLTVV44 pKa = 3.1
Molecular weight: 5.25 kDa
Isoelectric point according different methods:
Peptides (in silico digests for buttom-up proteomics)
Below you can find in silico digests of the whole proteome with Trypsin, Chymotrypsin, Trypsin+LysC, LysN, ArgC proteases suitable for different mass spec machines.| Try ESI |
 |
|---|
| ChTry ESI |
 |
|---|
| ArgC ESI |
 |
|---|
| LysN ESI |
 |
|---|
| TryLysC ESI |
 |
|---|
| Try MALDI |
 |
|---|
| ChTry MALDI |
 |
|---|
| ArgC MALDI |
 |
|---|
| LysN MALDI |
 |
|---|
| TryLysC MALDI |
 |
|---|
| Try LTQ |
 |
|---|
| ChTry LTQ |
 |
|---|
| ArgC LTQ |
 |
|---|
| LysN LTQ |
 |
|---|
| TryLysC LTQ |
 |
|---|
| Try MSlow |
 |
|---|
| ChTry MSlow |
 |
|---|
| ArgC MSlow |
 |
|---|
| LysN MSlow |
 |
|---|
| TryLysC MSlow |
 |
|---|
| Try MShigh |
 |
|---|
| ChTry MShigh |
 |
|---|
| ArgC MShigh |
 |
|---|
| LysN MShigh |
 |
|---|
| TryLysC MShigh |
 |
|---|
General Statistics
Number of major isoforms |
Number of additional isoforms |
Number of all proteins |
Number of amino acids |
Min. Seq. Length |
Max. Seq. Length |
Avg. Seq. Length |
Avg. Mol. Weight |
|---|---|---|---|---|---|---|---|
0 |
977135 |
37 |
2473 |
317.3 |
35.06 |
Amino acid frequency
Ala |
Cys |
Asp |
Glu |
Phe |
Gly |
His |
Ile |
Lys |
Leu |
|---|---|---|---|---|---|---|---|---|---|
10.292 ± 0.063 | 1.768 ± 0.022 |
5.709 ± 0.035 | 6.155 ± 0.044 |
3.778 ± 0.033 | 7.394 ± 0.037 |
1.967 ± 0.018 | 5.493 ± 0.042 |
5.055 ± 0.04 | 9.597 ± 0.058 |
Met |
Asn |
Gln |
Pro |
Arg |
Ser |
Thr |
Val |
Trp |
Tyr |
|---|---|---|---|---|---|---|---|---|---|
2.809 ± 0.024 | 3.752 ± 0.028 |
4.336 ± 0.028 | 3.848 ± 0.039 |
5.164 ± 0.041 | 5.162 ± 0.032 |
5.911 ± 0.041 | 6.903 ± 0.036 |
1.16 ± 0.019 | 3.747 ± 0.029 |
Most of the basic statistics you can see at this page can be downloaded from this CSV file
Proteome-pI is available under Creative Commons Attribution-NoDerivs license, for more details see here
| Reference: Kozlowski LP. Proteome-pI 2.0: Proteome Isoelectric Point Database Update. Nucleic Acids Res. 2021, doi: 10.1093/nar/gkab944 | Contact: Lukasz P. Kozlowski |
