Arthrobacter sp. Leaf69
Taxonomy: cellular organisms; Bacteria; Terrabacteria group; Actinobacteria; Actinomycetia; Micrococcales; Micrococcaceae; Arthrobacter; unclassified Arthrobacter
Average proteome isoelectric point is 6.18
Get precalculated fractions of proteins

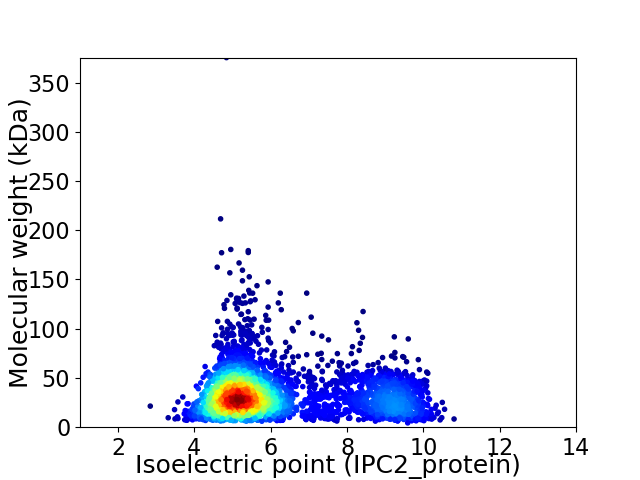
Virtual 2D-PAGE plot for 3584 proteins (isoelectric point calculated using IPC2_protein)
Get csv file with sequences according to given criteria:
* You can choose from 21 different methods for calculating isoelectric point
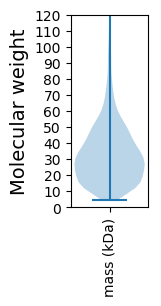
Summary statistics related to proteome-wise predictions


Protein with the lowest isoelectric point:
>tr|A0A0S9BYT1|A0A0S9BYT1_9MICC ABC transmembrane type-1 domain-containing protein OS=Arthrobacter sp. Leaf69 OX=1736232 GN=ASE96_13375 PE=3 SV=1
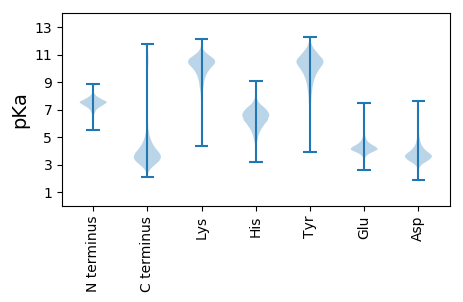
MM1 pKa = 7.2PTGAKK6 pKa = 8.74HH7 pKa = 6.41QKK9 pKa = 8.76FTDD12 pKa = 3.4IEE14 pKa = 4.28DD15 pKa = 3.86EE16 pKa = 4.27PGISYY21 pKa = 11.1GEE23 pKa = 4.22DD24 pKa = 3.28CRR26 pKa = 11.84CTIGEE31 pKa = 4.27DD32 pKa = 3.71HH33 pKa = 7.28NSGDD37 pKa = 3.95DD38 pKa = 3.63TALSNYY44 pKa = 9.82LSEE47 pKa = 5.61SDD49 pKa = 6.02AEE51 pKa = 4.94DD52 pKa = 2.83IWLSSGMDD60 pKa = 3.19EE61 pKa = 6.22DD62 pKa = 4.61YY63 pKa = 11.46DD64 pKa = 4.01FRR66 pKa = 6.63
MM1 pKa = 7.2PTGAKK6 pKa = 8.74HH7 pKa = 6.41QKK9 pKa = 8.76FTDD12 pKa = 3.4IEE14 pKa = 4.28DD15 pKa = 3.86EE16 pKa = 4.27PGISYY21 pKa = 11.1GEE23 pKa = 4.22DD24 pKa = 3.28CRR26 pKa = 11.84CTIGEE31 pKa = 4.27DD32 pKa = 3.71HH33 pKa = 7.28NSGDD37 pKa = 3.95DD38 pKa = 3.63TALSNYY44 pKa = 9.82LSEE47 pKa = 5.61SDD49 pKa = 6.02AEE51 pKa = 4.94DD52 pKa = 2.83IWLSSGMDD60 pKa = 3.19EE61 pKa = 6.22DD62 pKa = 4.61YY63 pKa = 11.46DD64 pKa = 4.01FRR66 pKa = 6.63
Molecular weight: 7.38 kDa
Isoelectric point according different methods:
Protein with the highest isoelectric point:
>tr|A0A0S9CNK6|A0A0S9CNK6_9MICC Lipoprotein OS=Arthrobacter sp. Leaf69 OX=1736232 GN=ASE96_03000 PE=3 SV=1
MM1 pKa = 7.54AAMLGMLAGAGLLLIWWSAWEE22 pKa = 4.03RR23 pKa = 11.84PGKK26 pKa = 9.9FRR28 pKa = 11.84SAPRR32 pKa = 11.84RR33 pKa = 11.84SRR35 pKa = 11.84LEE37 pKa = 3.86DD38 pKa = 3.54LLRR41 pKa = 11.84TAGIEE46 pKa = 4.2KK47 pKa = 10.53VSGPGLLASCVGVGVFTTLVFFAVTKK73 pKa = 9.03SWPIAGCFGLFGGWLPMAIVKK94 pKa = 8.77WRR96 pKa = 11.84ARR98 pKa = 11.84KK99 pKa = 8.75RR100 pKa = 11.84AAVLRR105 pKa = 11.84QLWPDD110 pKa = 3.4VVDD113 pKa = 4.04HH114 pKa = 6.45LRR116 pKa = 11.84SAIRR120 pKa = 11.84AGLSLPEE127 pKa = 4.5ALIQLGDD134 pKa = 3.65KK135 pKa = 10.88GPEE138 pKa = 3.88EE139 pKa = 3.91LRR141 pKa = 11.84HH142 pKa = 4.86VFRR145 pKa = 11.84HH146 pKa = 5.83FGSDD150 pKa = 3.47YY151 pKa = 10.84RR152 pKa = 11.84SGGQFDD158 pKa = 4.12PSLTRR163 pKa = 11.84LKK165 pKa = 10.92DD166 pKa = 3.55RR167 pKa = 11.84LADD170 pKa = 3.73PVADD174 pKa = 5.02RR175 pKa = 11.84IVEE178 pKa = 4.04ALRR181 pKa = 11.84LTRR184 pKa = 11.84EE185 pKa = 4.13VGGSDD190 pKa = 3.9LGRR193 pKa = 11.84LLGTLAEE200 pKa = 4.53FLRR203 pKa = 11.84EE204 pKa = 4.06SARR207 pKa = 11.84TRR209 pKa = 11.84SEE211 pKa = 3.96LEE213 pKa = 3.8ARR215 pKa = 11.84QSWTVNAARR224 pKa = 11.84LAVAAPWIVLVLLASRR240 pKa = 11.84PEE242 pKa = 3.69AVAAYY247 pKa = 6.76NTPVGTAVLLGGLSVSLISYY267 pKa = 10.69AVMLRR272 pKa = 11.84IGALPEE278 pKa = 3.98DD279 pKa = 4.19EE280 pKa = 4.3RR281 pKa = 11.84VLRR284 pKa = 4.46
MM1 pKa = 7.54AAMLGMLAGAGLLLIWWSAWEE22 pKa = 4.03RR23 pKa = 11.84PGKK26 pKa = 9.9FRR28 pKa = 11.84SAPRR32 pKa = 11.84RR33 pKa = 11.84SRR35 pKa = 11.84LEE37 pKa = 3.86DD38 pKa = 3.54LLRR41 pKa = 11.84TAGIEE46 pKa = 4.2KK47 pKa = 10.53VSGPGLLASCVGVGVFTTLVFFAVTKK73 pKa = 9.03SWPIAGCFGLFGGWLPMAIVKK94 pKa = 8.77WRR96 pKa = 11.84ARR98 pKa = 11.84KK99 pKa = 8.75RR100 pKa = 11.84AAVLRR105 pKa = 11.84QLWPDD110 pKa = 3.4VVDD113 pKa = 4.04HH114 pKa = 6.45LRR116 pKa = 11.84SAIRR120 pKa = 11.84AGLSLPEE127 pKa = 4.5ALIQLGDD134 pKa = 3.65KK135 pKa = 10.88GPEE138 pKa = 3.88EE139 pKa = 3.91LRR141 pKa = 11.84HH142 pKa = 4.86VFRR145 pKa = 11.84HH146 pKa = 5.83FGSDD150 pKa = 3.47YY151 pKa = 10.84RR152 pKa = 11.84SGGQFDD158 pKa = 4.12PSLTRR163 pKa = 11.84LKK165 pKa = 10.92DD166 pKa = 3.55RR167 pKa = 11.84LADD170 pKa = 3.73PVADD174 pKa = 5.02RR175 pKa = 11.84IVEE178 pKa = 4.04ALRR181 pKa = 11.84LTRR184 pKa = 11.84EE185 pKa = 4.13VGGSDD190 pKa = 3.9LGRR193 pKa = 11.84LLGTLAEE200 pKa = 4.53FLRR203 pKa = 11.84EE204 pKa = 4.06SARR207 pKa = 11.84TRR209 pKa = 11.84SEE211 pKa = 3.96LEE213 pKa = 3.8ARR215 pKa = 11.84QSWTVNAARR224 pKa = 11.84LAVAAPWIVLVLLASRR240 pKa = 11.84PEE242 pKa = 3.69AVAAYY247 pKa = 6.76NTPVGTAVLLGGLSVSLISYY267 pKa = 10.69AVMLRR272 pKa = 11.84IGALPEE278 pKa = 3.98DD279 pKa = 4.19EE280 pKa = 4.3RR281 pKa = 11.84VLRR284 pKa = 4.46
Molecular weight: 30.99 kDa
Isoelectric point according different methods:
Peptides (in silico digests for buttom-up proteomics)
Below you can find in silico digests of the whole proteome with Trypsin, Chymotrypsin, Trypsin+LysC, LysN, ArgC proteases suitable for different mass spec machines.| Try ESI |
 |
|---|
| ChTry ESI |
 |
|---|
| ArgC ESI |
 |
|---|
| LysN ESI |
 |
|---|
| TryLysC ESI |
 |
|---|
| Try MALDI |
 |
|---|
| ChTry MALDI |
 |
|---|
| ArgC MALDI |
 |
|---|
| LysN MALDI |
 |
|---|
| TryLysC MALDI |
 |
|---|
| Try LTQ |
 |
|---|
| ChTry LTQ |
 |
|---|
| ArgC LTQ |
 |
|---|
| LysN LTQ |
 |
|---|
| TryLysC LTQ |
 |
|---|
| Try MSlow |
 |
|---|
| ChTry MSlow |
 |
|---|
| ArgC MSlow |
 |
|---|
| LysN MSlow |
 |
|---|
| TryLysC MSlow |
 |
|---|
| Try MShigh |
 |
|---|
| ChTry MShigh |
 |
|---|
| ArgC MShigh |
 |
|---|
| LysN MShigh |
 |
|---|
| TryLysC MShigh |
 |
|---|
General Statistics
Number of major isoforms |
Number of additional isoforms |
Number of all proteins |
Number of amino acids |
Min. Seq. Length |
Max. Seq. Length |
Avg. Seq. Length |
Avg. Mol. Weight |
|---|---|---|---|---|---|---|---|
0 |
1172066 |
37 |
3563 |
327.0 |
34.95 |
Amino acid frequency
Ala |
Cys |
Asp |
Glu |
Phe |
Gly |
His |
Ile |
Lys |
Leu |
|---|---|---|---|---|---|---|---|---|---|
13.339 ± 0.056 | 0.595 ± 0.01 |
5.664 ± 0.031 | 5.612 ± 0.04 |
3.237 ± 0.027 | 9.201 ± 0.033 |
2.05 ± 0.016 | 4.317 ± 0.026 |
2.794 ± 0.033 | 10.286 ± 0.055 |
Met |
Asn |
Gln |
Pro |
Arg |
Ser |
Thr |
Val |
Trp |
Tyr |
|---|---|---|---|---|---|---|---|---|---|
2.009 ± 0.017 | 2.405 ± 0.021 |
5.482 ± 0.036 | 3.075 ± 0.022 |
6.562 ± 0.039 | 5.79 ± 0.024 |
5.802 ± 0.029 | 8.319 ± 0.032 |
1.41 ± 0.019 | 2.051 ± 0.021 |
Most of the basic statistics you can see at this page can be downloaded from this CSV file
Proteome-pI is available under Creative Commons Attribution-NoDerivs license, for more details see here
| Reference: Kozlowski LP. Proteome-pI 2.0: Proteome Isoelectric Point Database Update. Nucleic Acids Res. 2021, doi: 10.1093/nar/gkab944 | Contact: Lukasz P. Kozlowski |
