Streptomyces sp. M41(2017)
Taxonomy: cellular organisms; Bacteria; Terrabacteria group; Actinobacteria; Actinomycetia; Streptomycetales; Streptomycetaceae; Streptomyces; unclassified Streptomyces
Average proteome isoelectric point is 6.39
Get precalculated fractions of proteins

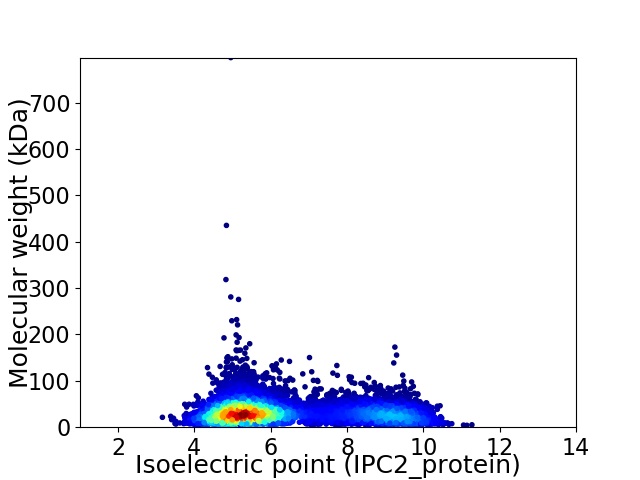
Virtual 2D-PAGE plot for 7701 proteins (isoelectric point calculated using IPC2_protein)
Get csv file with sequences according to given criteria:
* You can choose from 21 different methods for calculating isoelectric point
Summary statistics related to proteome-wise predictions


Protein with the lowest isoelectric point:
>tr|A0A1V9KDT7|A0A1V9KDT7_9ACTN Uncharacterized protein OS=Streptomyces sp. M41(2017) OX=1955065 GN=B0675_11870 PE=4 SV=1
MM1 pKa = 7.12STPAIPVLSEE11 pKa = 4.55LDD13 pKa = 4.62DD14 pKa = 4.08IPPLSFTTPEE24 pKa = 4.42GFFSLPLAATPDD36 pKa = 3.36DD37 pKa = 3.68RR38 pKa = 11.84AALSEE43 pKa = 4.35SFVRR47 pKa = 11.84EE48 pKa = 3.94LYY50 pKa = 10.77SRR52 pKa = 11.84GDD54 pKa = 3.38EE55 pKa = 4.49ALWTPAAPYY64 pKa = 9.52YY65 pKa = 10.72AALAEE70 pKa = 4.26QLAHH74 pKa = 6.22TGVSYY79 pKa = 11.16SAMGLFSTDD88 pKa = 2.86DD89 pKa = 3.73GGVVQCALTVAAVEE103 pKa = 4.47TEE105 pKa = 3.75QDD107 pKa = 3.54DD108 pKa = 4.42PEE110 pKa = 4.82IAAHH114 pKa = 7.17GILTALSSDD123 pKa = 3.46PHH125 pKa = 7.76RR126 pKa = 11.84DD127 pKa = 3.62ARR129 pKa = 11.84WLDD132 pKa = 4.17LPCGPAVSCVTMRR145 pKa = 11.84EE146 pKa = 3.88VTLAPEE152 pKa = 4.45VTASGAEE159 pKa = 4.11VQLLTGQIQVQVPFPTGPYY178 pKa = 8.31TAVFTLDD185 pKa = 3.52TASTEE190 pKa = 4.17YY191 pKa = 9.93WGEE194 pKa = 3.91FCDD197 pKa = 5.55LLIAVLRR204 pKa = 11.84TLSFRR209 pKa = 11.84DD210 pKa = 3.6TAPDD214 pKa = 3.18ISDD217 pKa = 3.54AASS220 pKa = 2.89
MM1 pKa = 7.12STPAIPVLSEE11 pKa = 4.55LDD13 pKa = 4.62DD14 pKa = 4.08IPPLSFTTPEE24 pKa = 4.42GFFSLPLAATPDD36 pKa = 3.36DD37 pKa = 3.68RR38 pKa = 11.84AALSEE43 pKa = 4.35SFVRR47 pKa = 11.84EE48 pKa = 3.94LYY50 pKa = 10.77SRR52 pKa = 11.84GDD54 pKa = 3.38EE55 pKa = 4.49ALWTPAAPYY64 pKa = 9.52YY65 pKa = 10.72AALAEE70 pKa = 4.26QLAHH74 pKa = 6.22TGVSYY79 pKa = 11.16SAMGLFSTDD88 pKa = 2.86DD89 pKa = 3.73GGVVQCALTVAAVEE103 pKa = 4.47TEE105 pKa = 3.75QDD107 pKa = 3.54DD108 pKa = 4.42PEE110 pKa = 4.82IAAHH114 pKa = 7.17GILTALSSDD123 pKa = 3.46PHH125 pKa = 7.76RR126 pKa = 11.84DD127 pKa = 3.62ARR129 pKa = 11.84WLDD132 pKa = 4.17LPCGPAVSCVTMRR145 pKa = 11.84EE146 pKa = 3.88VTLAPEE152 pKa = 4.45VTASGAEE159 pKa = 4.11VQLLTGQIQVQVPFPTGPYY178 pKa = 8.31TAVFTLDD185 pKa = 3.52TASTEE190 pKa = 4.17YY191 pKa = 9.93WGEE194 pKa = 3.91FCDD197 pKa = 5.55LLIAVLRR204 pKa = 11.84TLSFRR209 pKa = 11.84DD210 pKa = 3.6TAPDD214 pKa = 3.18ISDD217 pKa = 3.54AASS220 pKa = 2.89
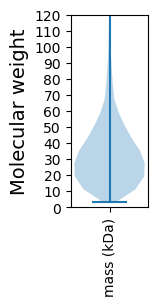
Molecular weight: 23.36 kDa
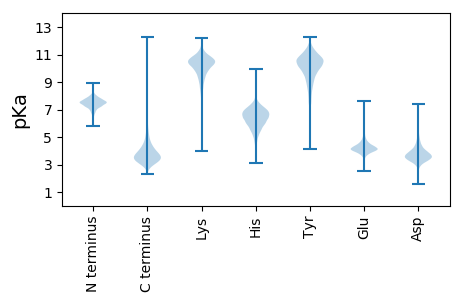
Isoelectric point according different methods:
Protein with the highest isoelectric point:
>tr|A0A1V9KCL0|A0A1V9KCL0_9ACTN Molybdopterin molybdenumtransferase OS=Streptomyces sp. M41(2017) OX=1955065 GN=B0675_09515 PE=3 SV=1
MM1 pKa = 7.69SKK3 pKa = 9.0RR4 pKa = 11.84TFQPNNRR11 pKa = 11.84RR12 pKa = 11.84RR13 pKa = 11.84AKK15 pKa = 8.7THH17 pKa = 5.15GFRR20 pKa = 11.84LRR22 pKa = 11.84MRR24 pKa = 11.84TRR26 pKa = 11.84AGRR29 pKa = 11.84AILANRR35 pKa = 11.84RR36 pKa = 11.84GKK38 pKa = 10.51GRR40 pKa = 11.84ASLSAA45 pKa = 3.83
MM1 pKa = 7.69SKK3 pKa = 9.0RR4 pKa = 11.84TFQPNNRR11 pKa = 11.84RR12 pKa = 11.84RR13 pKa = 11.84AKK15 pKa = 8.7THH17 pKa = 5.15GFRR20 pKa = 11.84LRR22 pKa = 11.84MRR24 pKa = 11.84TRR26 pKa = 11.84AGRR29 pKa = 11.84AILANRR35 pKa = 11.84RR36 pKa = 11.84GKK38 pKa = 10.51GRR40 pKa = 11.84ASLSAA45 pKa = 3.83
Molecular weight: 5.21 kDa
Isoelectric point according different methods:
Peptides (in silico digests for buttom-up proteomics)
Below you can find in silico digests of the whole proteome with Trypsin, Chymotrypsin, Trypsin+LysC, LysN, ArgC proteases suitable for different mass spec machines.| Try ESI |
 |
|---|
| ChTry ESI |
 |
|---|
| ArgC ESI |
 |
|---|
| LysN ESI |
 |
|---|
| TryLysC ESI |
 |
|---|
| Try MALDI |
 |
|---|
| ChTry MALDI |
 |
|---|
| ArgC MALDI |
 |
|---|
| LysN MALDI |
 |
|---|
| TryLysC MALDI |
 |
|---|
| Try LTQ |
 |
|---|
| ChTry LTQ |
 |
|---|
| ArgC LTQ |
 |
|---|
| LysN LTQ |
 |
|---|
| TryLysC LTQ |
 |
|---|
| Try MSlow |
 |
|---|
| ChTry MSlow |
 |
|---|
| ArgC MSlow |
 |
|---|
| LysN MSlow |
 |
|---|
| TryLysC MSlow |
 |
|---|
| Try MShigh |
 |
|---|
| ChTry MShigh |
 |
|---|
| ArgC MShigh |
 |
|---|
| LysN MShigh |
 |
|---|
| TryLysC MShigh |
 |
|---|
General Statistics
Number of major isoforms |
Number of additional isoforms |
Number of all proteins |
Number of amino acids |
Min. Seq. Length |
Max. Seq. Length |
Avg. Seq. Length |
Avg. Mol. Weight |
|---|---|---|---|---|---|---|---|
0 |
2489732 |
29 |
7416 |
323.3 |
34.57 |
Amino acid frequency
Ala |
Cys |
Asp |
Glu |
Phe |
Gly |
His |
Ile |
Lys |
Leu |
|---|---|---|---|---|---|---|---|---|---|
13.492 ± 0.04 | 0.759 ± 0.008 |
6.14 ± 0.022 | 5.522 ± 0.031 |
2.745 ± 0.016 | 9.569 ± 0.026 |
2.298 ± 0.015 | 3.146 ± 0.019 |
2.201 ± 0.021 | 10.231 ± 0.034 |
Met |
Asn |
Gln |
Pro |
Arg |
Ser |
Thr |
Val |
Trp |
Tyr |
|---|---|---|---|---|---|---|---|---|---|
1.722 ± 0.011 | 1.777 ± 0.014 |
6.023 ± 0.027 | 2.742 ± 0.013 |
7.947 ± 0.033 | 5.256 ± 0.023 |
6.282 ± 0.026 | 8.546 ± 0.024 |
1.517 ± 0.013 | 2.085 ± 0.012 |
Most of the basic statistics you can see at this page can be downloaded from this CSV file
Proteome-pI is available under Creative Commons Attribution-NoDerivs license, for more details see here
| Reference: Kozlowski LP. Proteome-pI 2.0: Proteome Isoelectric Point Database Update. Nucleic Acids Res. 2021, doi: 10.1093/nar/gkab944 | Contact: Lukasz P. Kozlowski |
